See more : Almunda Professionals N.V. (AMUND.AS) Income Statement Analysis – Financial Results
Complete financial analysis of Tianrong Internet Products and Services, Inc. (TIPS) income statement, including revenue, profit margins, EPS and key performance metrics. Get detailed insights into the financial performance of Tianrong Internet Products and Services, Inc., a leading company in the Specialty Retail industry within the Consumer Cyclical sector.
- Enbridge Inc (ENB-PA.TO) Income Statement Analysis – Financial Results
- Ladybug Resource Group, Inc. (LBRG) Income Statement Analysis – Financial Results
- Tyntek Corporation (2426.TW) Income Statement Analysis – Financial Results
- Oi Wah Pawnshop Credit Holdings Limited (1319.HK) Income Statement Analysis – Financial Results
- Beijing Sinnet Technology Co., Ltd (300383.SZ) Income Statement Analysis – Financial Results
Tianrong Internet Products and Services, Inc. (TIPS)
Industry: Specialty Retail
Sector: Consumer Cyclical
About Tianrong Internet Products and Services, Inc.
Tianrong Internet Products and Services, Inc. is an investment company that focuses on investing in medical companies. The company was incorporated in 1959 and is based in Mountainhome, Pennsylvania. As of December 3, 2021, Tianrong Internet Products and Services, Inc. operates as a subsidiary of Wilton Management Ltd.
| Metric | 2023 | 2022 | 2021 | 2020 | 2019 | 2018 | 2012 | 2011 | 2010 |
|---|---|---|---|---|---|---|---|---|---|
| Revenue | 100.00K | 0.00 | 0.00 | 0.00 | 0.00 | 0.00 | 0.00 | 0.00 | 0.00 |
| Cost of Revenue | 0.00 | 0.00 | 0.00 | 0.00 | 0.00 | 0.00 | 0.00 | 0.00 | 0.00 |
| Gross Profit | 100.00K | 0.00 | 0.00 | 0.00 | 0.00 | 0.00 | 0.00 | 0.00 | 0.00 |
| Gross Profit Ratio | 100.00% | 0.00% | 0.00% | 0.00% | 0.00% | 0.00% | 0.00% | 0.00% | 0.00% |
| Research & Development | 0.00 | 0.00 | 0.00 | 0.00 | 0.00 | 0.00 | 0.00 | 0.00 | 0.00 |
| General & Administrative | 0.00 | 0.00 | 0.00 | 0.00 | 0.00 | 0.00 | 0.00 | 0.00 | 0.00 |
| Selling & Marketing | 0.00 | 0.00 | 0.00 | 0.00 | 0.00 | 0.00 | 0.00 | 0.00 | 0.00 |
| SG&A | 147.65K | 98.43K | 47.29K | 1.53K | 1.01K | 0.00 | 170.64K | 117.50K | 0.00 |
| Other Expenses | 0.00 | 0.00 | 0.00 | 0.00 | 0.00 | 3.00 | 0.00 | 0.00 | 0.00 |
| Operating Expenses | 147.65K | 98.43K | 47.29K | 1.53K | 1.01K | 3.00 | 170.64K | 117.50K | 0.00 |
| Cost & Expenses | 147.65K | 98.43K | 47.29K | 1.53K | 1.01K | 3.00 | 170.64K | 117.50K | 0.00 |
| Interest Income | 0.00 | 0.00 | 0.00 | 0.00 | 0.00 | 0.00 | 0.00 | 0.00 | 0.00 |
| Interest Expense | 19.44K | 25.29K | 15.81K | 19.06K | 25.78K | 27.65K | 0.00 | 0.00 | 0.00 |
| Depreciation & Amortization | 167.90K | 228.49K | 236.56K | 206.30K | 171.86K | 161.14K | 0.00 | 0.00 | 0.00 |
| EBITDA | -47.65K | -56.53K | -47.29K | -12.81K | -1.01K | 3.00 | -170.64K | -117.50K | 0.00 |
| EBITDA Ratio | -47.65% | 0.00% | 0.00% | 0.00% | 0.00% | 0.00% | 0.00% | 0.00% | 0.00% |
| Operating Income | -47.65K | -98.43K | -47.29K | -1.53K | -1.01K | 3.00 | -170.64K | -117.50K | 0.00 |
| Operating Income Ratio | -47.65% | 0.00% | 0.00% | 0.00% | 0.00% | 0.00% | 0.00% | 0.00% | 0.00% |
| Total Other Income/Expenses | -19.44K | 16.61K | -13.84K | -30.33K | -25.78K | -34.65K | -93.27K | 3.00 | 0.00 |
| Income Before Tax | -67.09K | -81.82K | -61.13K | -31.86K | -26.79K | -34.65K | -263.91K | -117.50K | 0.00 |
| Income Before Tax Ratio | -67.09% | 0.00% | 0.00% | 0.00% | 0.00% | 0.00% | 0.00% | 0.00% | 0.00% |
| Income Tax Expense | -167.90K | -228.49K | -236.56K | -206.30K | -171.86K | -161.14K | 0.00 | 2.10K | 0.00 |
| Net Income | -67.09K | -81.82K | -61.13K | -31.86K | -26.79K | -34.65K | -263.91K | -119.60K | 0.00 |
| Net Income Ratio | -67.09% | 0.00% | 0.00% | 0.00% | 0.00% | 0.00% | 0.00% | 0.00% | 0.00% |
| EPS | 0.00 | 0.00 | 0.00 | 0.00 | 0.00 | 0.00 | 0.00 | 0.00 | 0.00 |
| EPS Diluted | 0.00 | 0.00 | 0.00 | 0.00 | 0.00 | 0.00 | 0.00 | 0.00 | 0.00 |
| Weighted Avg Shares Out | 84.67M | 84.89M | 84.89M | 84.89M | 84.89M | 84.89M | 84.89M | 84.89M | 84.89M |
| Weighted Avg Shares Out (Dil) | 84.67M | 84.89M | 84.89M | 84.89M | 84.89M | 84.89M | 84.89M | 84.89M | 84.89M |
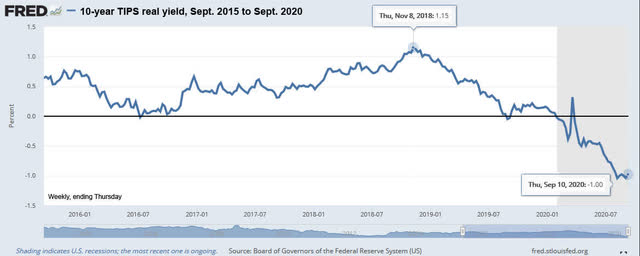
10-Year TIPS: Keep An Eye On The Inflation Breakeven Rate
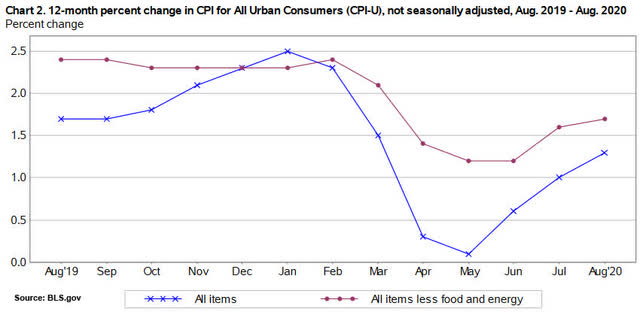
August Inflation: What It Means For Social Security, TIPS And I Bonds
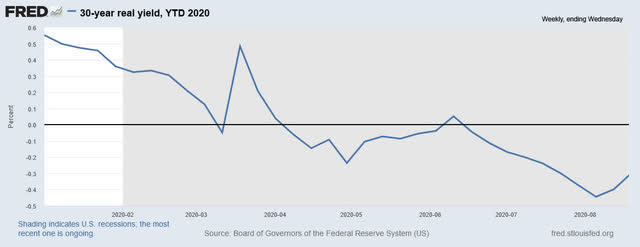
30-Year TIPS Reopening Gets First Negative Real Yield In History
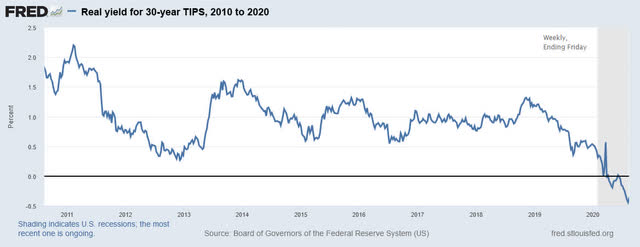
30-Year TIPS: Poster Child For A 'Volatile' Safe Investment

Straight From PIMCO: Our Take On The TIPS Market

MIDAS SHARE TIPS: Economic woe is good news for FRP Advisory
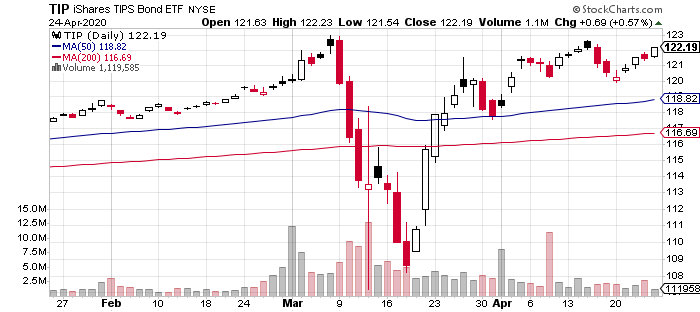
TIPS And Foreign Corporates Rose Last Week As Stocks Fell
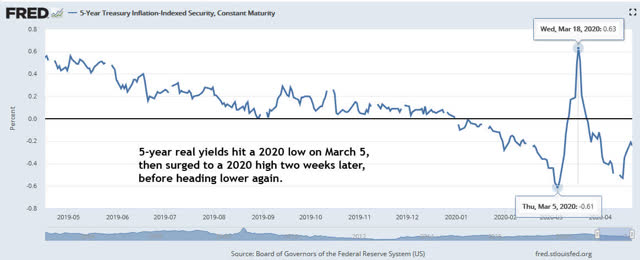
Real Yield On New 5-Year TIPS Dips Deeply Negative, At -0.32%

TIPS ETFs in a Sweet Spot: Here's Why

[TIPS] Pokemon GO Ultra League: Best Pokemon, Weapons, and Attacks You'll Need to Win
Source: https://incomestatements.info
Category: Stock Reports
