See more : Clearday, Inc. (CLRD) Income Statement Analysis – Financial Results
Complete financial analysis of Telstra Corporation Limited (TLSYY) income statement, including revenue, profit margins, EPS and key performance metrics. Get detailed insights into the financial performance of Telstra Corporation Limited, a leading company in the Telecommunications Services industry within the Communication Services sector.
- KHD Humboldt Wedag International AG (KWG.DE) Income Statement Analysis – Financial Results
- ShinHsiung Natural Gas Inc. (8908.TWO) Income Statement Analysis – Financial Results
- Wistron Information Technology & Services Corporation (4953.TWO) Income Statement Analysis – Financial Results
- Titan Securities Limited (TITANSEC.BO) Income Statement Analysis – Financial Results
- CFI-Compagnie Foncière Internationale (CFI.PA) Income Statement Analysis – Financial Results
Telstra Corporation Limited (TLSYY)
Industry: Telecommunications Services
Sector: Communication Services
Website: https://www.telstra.com.au
About Telstra Corporation Limited
Telstra Corporation Limited provides telecommunications and information services to businesses, governments, and individuals in Australia and internationally. It operates in four segments: Telstra Consumer and Small Business, Telstra Enterprise, Networks and IT, and Telstra InfraCo. The company offers telecommunication products, services, and solutions across mobiles, fixed and mobile broadband, media, and digital content in prepaid and post-paid services, as well as operates call centers, Telstra shops, and the Telstra dealership network. It also provides network capacity and management, unified communications, cloud, industry solutions, integrated and monitoring services to government and large enterprise customers; builds and manages digital platforms; and provides telecommunication products and services to other carriers, carriage service providers, and internet service providers. In addition, the company operates the fixed passive network infrastructure, including data centers, exchanges, poles, ducts, pits and pipes, fiber network, and mobile towers; provides wholesale customers with access to network infrastructure; provides long-term access to components of infrastructure and network services under the infrastructure services agreement and commercial contracts; and designs and constructs fiber, exchanges, and other infrastructure. The company was formerly known as Australian and Overseas Telecommunications Corporation Limited and changed its name to Telstra Corporation Limited in April 1993. Telstra Corporation Limited was founded in 1901 and is based in Melbourne, Australia.
| Metric | 2022 | 2021 | 2020 | 2019 | 2018 | 2017 | 2016 | 2015 | 2014 | 2013 | 2012 | 2011 | 2010 | 2009 | 2008 | 2007 | 2006 | 2005 | 2004 | 2003 | 2002 | 2001 | 2000 | 1999 | 1998 | 1997 | 1996 | 1995 | 1994 | 1993 |
|---|---|---|---|---|---|---|---|---|---|---|---|---|---|---|---|---|---|---|---|---|---|---|---|---|---|---|---|---|---|---|
| Revenue | 20.92B | 21.00B | 22.77B | 25.26B | 26.01B | 26.01B | 25.91B | 26.02B | 25.12B | 25.50B | 25.33B | 25.09B | 24.92B | 25.48B | 24.79B | 23.67B | 22.75B | 22.24B | 20.95B | 20.50B | 20.20B | 18.68B | 18.61B | 17.57B | 16.82B | 15.66B | 14.90B | 13.78B | 12.92B | 0.00 |
| Cost of Revenue | 8.23B | 8.32B | 9.11B | 9.14B | 8.76B | 7.67B | 7.25B | 6.87B | 6.50B | 6.42B | 6.22B | 6.18B | 5.36B | 1.90B | 2.00B | 5.17B | 4.73B | 4.15B | 3.42B | 3.62B | 3.97B | 3.13B | 3.33B | 3.00B | 2.58B | 0.00 | 0.00 | 0.00 | 0.00 | 0.00 |
| Gross Profit | 12.69B | 12.68B | 13.66B | 16.12B | 17.25B | 18.34B | 18.66B | 19.15B | 18.62B | 19.08B | 19.11B | 18.91B | 19.56B | 23.58B | 22.79B | 18.50B | 18.02B | 18.09B | 17.53B | 16.88B | 16.23B | 15.55B | 15.28B | 14.57B | 14.24B | 15.66B | 14.90B | 13.78B | 12.92B | 0.00 |
| Gross Profit Ratio | 60.67% | 60.39% | 60.00% | 63.82% | 66.33% | 70.51% | 72.03% | 73.60% | 74.14% | 74.83% | 75.46% | 75.36% | 78.49% | 92.56% | 91.92% | 78.16% | 79.21% | 81.35% | 83.68% | 82.36% | 80.36% | 83.23% | 82.11% | 82.92% | 84.65% | 100.00% | 100.00% | 100.00% | 100.00% | 0.00% |
| Research & Development | 0.00 | 0.00 | 0.00 | 0.00 | 0.00 | 0.00 | 0.00 | 2.00M | 4.00M | 2.00M | 5.00M | 6.00M | 9.00M | 8.00M | 9.00M | 9.00M | 23.00M | 29.00M | 0.00 | 0.00 | 28.00M | 29.00M | 0.00 | 0.00 | 0.00 | 58.00M | 86.20M | 72.50M | 81.00M | 0.00 |
| General & Administrative | 4.56B | 4.96B | 5.40B | 6.98B | 7.28B | 7.10B | 6.67B | 6.52B | 6.34B | 6.43B | 5.63B | 5.39B | 5.20B | 5.79B | 5.80B | 5.58B | 5.75B | 5.10B | 3.22B | 4.30B | 4.61B | 3.12B | 3.63B | 3.53B | 3.88B | 244.03M | 379.42M | 504.89M | 293.85M | 6.81B |
| Selling & Marketing | 248.00M | 248.00M | 268.00M | 310.00M | 344.00M | 330.00M | 301.00M | 421.00M | 346.00M | 309.00M | 327.00M | 334.00M | 349.00M | 379.00M | 457.00M | 422.00M | 2.19B | 1.89B | 0.00 | 316.00M | 284.00M | 0.00 | 0.00 | 0.00 | 0.00 | 0.00 | 0.00 | 0.00 | 0.00 | 0.00 |
| SG&A | 4.80B | 5.20B | 5.67B | 7.29B | 7.63B | 7.43B | 6.97B | 6.94B | 6.69B | 6.74B | 5.96B | 5.72B | 5.55B | 6.17B | 6.26B | 6.00B | 7.95B | 6.98B | 3.22B | 4.61B | 4.90B | 3.12B | 3.63B | 3.53B | 3.88B | 244.03M | 379.42M | 504.89M | 293.85M | 6.81B |
| Other Expenses | 5.84B | 6.02B | 7.18B | 6.26B | 6.42B | 6.59B | 6.05B | 6.04B | 5.61B | 6.03B | 7.29B | 7.26B | 7.02B | 10.62B | 10.15B | 6.65B | 4.58B | 4.30B | 7.99B | 5.72B | 5.29B | 6.73B | 5.82B | 5.77B | 5.71B | 2.68B | 2.51B | 2.48B | 2.32B | -11.21B |
| Operating Expenses | 10.65B | 11.22B | 12.85B | 13.55B | 14.04B | 14.02B | 13.03B | 12.98B | 12.30B | 12.77B | 13.25B | 12.98B | 12.58B | 16.80B | 16.42B | 12.66B | 12.55B | 11.31B | 11.21B | 10.33B | 10.22B | 9.88B | 9.45B | 9.30B | 9.59B | 2.98B | 2.97B | 3.06B | 2.70B | -4.40B |
| Cost & Expenses | 18.87B | 19.54B | 21.96B | 22.68B | 22.80B | 21.69B | 20.27B | 19.85B | 18.79B | 19.18B | 19.47B | 19.17B | 17.94B | 18.70B | 18.43B | 17.83B | 17.28B | 15.46B | 14.63B | 13.94B | 14.18B | 13.02B | 12.78B | 12.31B | 12.17B | 2.98B | 2.97B | 3.06B | 2.70B | -4.40B |
| Interest Income | 110.00M | 103.00M | 274.00M | 238.00M | 82.00M | 138.00M | 86.00M | 139.00M | 156.00M | 219.00M | 134.00M | 127.00M | 67.00M | 67.00M | 72.00M | 57.00M | 66.00M | 103.00M | 55.00M | 84.00M | 126.00M | 103.00M | 62.00M | 49.00M | 49.00M | 85.00M | 104.80M | 106.60M | 69.20M | 0.00 |
| Interest Expense | 449.00M | 571.00M | 936.00M | 868.00M | 631.00M | 729.00M | 796.00M | 846.00M | 1.11B | 1.13B | 1.02B | 1.26B | 1.03B | 967.00M | 1.15B | 1.13B | 996.00M | 834.00M | 767.00M | 878.00M | 894.00M | 767.00M | 629.00M | 569.00M | 618.00M | 504.00M | 510.90M | 480.60M | 726.80M | 775.00M |
| Depreciation & Amortization | 4.36B | 4.65B | 5.34B | 4.28B | 4.47B | 4.44B | 4.16B | 3.98B | 3.95B | 4.24B | 4.41B | 4.46B | 4.35B | 4.39B | 4.19B | 4.08B | 4.09B | 3.77B | 3.62B | 3.45B | 3.27B | 2.87B | 2.65B | 2.50B | 2.30B | 2.35B | 2.35B | 2.20B | 2.12B | 2.41B |
| EBITDA | 7.16B | 7.61B | 9.05B | 8.23B | 10.24B | 10.83B | 12.50B | 10.85B | 11.02B | 10.80B | 10.35B | 10.26B | 10.86B | 11.01B | 10.46B | 9.89B | 9.64B | 15.32B | 10.23B | 9.29B | 9.62B | 9.93B | 8.63B | 8.39B | 7.39B | 4.94B | 6.31B | 5.09B | 5.37B | 5.49B |
| EBITDA Ratio | 34.24% | 36.26% | 39.75% | 32.57% | 39.36% | 41.65% | 48.24% | 41.68% | 43.86% | 42.33% | 40.86% | 40.89% | 43.56% | 43.22% | 42.19% | 41.76% | 42.39% | 68.88% | 48.84% | 45.32% | 47.62% | 53.17% | 46.36% | 47.74% | 43.92% | 31.54% | 42.35% | 36.90% | 41.57% | 0.00% |
| Operating Income | 2.80B | 1.46B | 809.00M | 2.58B | 3.21B | 4.32B | 5.64B | 6.18B | 6.33B | 6.32B | 5.86B | 5.92B | 6.99B | 6.78B | 6.37B | 5.84B | 5.47B | 6.78B | 6.33B | 6.55B | 6.02B | 5.66B | 5.83B | 5.27B | 4.65B | 12.68B | 11.93B | 10.73B | 10.23B | 17.06B |
| Operating Income Ratio | 13.40% | 6.94% | 3.55% | 10.20% | 12.34% | 16.61% | 21.76% | 23.73% | 25.18% | 24.77% | 23.15% | 23.60% | 28.03% | 26.62% | 25.68% | 24.67% | 24.06% | 30.50% | 30.19% | 31.97% | 29.78% | 30.31% | 31.34% | 29.96% | 27.65% | 80.98% | 80.04% | 77.81% | 79.14% | 0.00% |
| Total Other Income/Expenses | -323.00M | 984.00M | 1.99B | 496.00M | 1.89B | 1.33B | -38.00M | -103.00M | -97.00M | -836.00M | -930.00M | -1.37B | -1.45B | -1.12B | -1.23B | -1.15B | -912.00M | -513.00M | -477.00M | -1.62B | -569.00M | 635.00M | -483.00M | 55.00M | -183.00M | -10.61B | -8.48B | -8.32B | -7.70B | -14.75B |
| Income Before Tax | 2.48B | 2.44B | 2.80B | 3.07B | 5.10B | 5.65B | 5.60B | 6.07B | 6.23B | 5.48B | 4.93B | 4.56B | 5.54B | 5.66B | 5.14B | 4.69B | 4.56B | 6.27B | 5.85B | 4.93B | 5.45B | 6.30B | 5.35B | 5.32B | 4.47B | 2.07B | 3.45B | 2.41B | 2.53B | 2.31B |
| Income Before Tax Ratio | 11.86% | 11.62% | 12.28% | 12.16% | 19.61% | 21.71% | 21.61% | 23.34% | 24.79% | 21.50% | 19.48% | 18.16% | 22.22% | 22.21% | 20.73% | 19.82% | 20.05% | 28.19% | 27.91% | 24.04% | 26.97% | 33.71% | 28.74% | 30.28% | 26.57% | 13.24% | 23.13% | 17.45% | 19.56% | 0.00% |
| Income Tax Expense | 667.00M | 539.00M | 957.00M | 923.00M | 1.57B | 1.77B | 1.77B | 1.79B | 1.68B | 1.62B | 1.51B | 1.31B | 1.60B | 1.58B | 1.43B | 1.42B | 1.38B | 6.27B | 5.85B | 4.93B | 5.45B | 6.30B | 5.35B | 5.32B | 4.47B | 2.07B | 3.45B | 2.41B | 2.53B | 2.31B |
| Net Income | 1.81B | 1.86B | 1.82B | 2.15B | 3.56B | 3.89B | 5.78B | 4.23B | 4.28B | 3.81B | 3.41B | 3.23B | 3.88B | 4.07B | 3.69B | 3.25B | 3.18B | 4.45B | 1.00M | 35.00M | 11.00M | -3.00M | 4.00M | -2.00M | 4.00M | 8.00M | 2.60M | -2.70M | -5.50M | 1.00M |
| Net Income Ratio | 8.67% | 8.84% | 7.99% | 8.53% | 13.70% | 14.96% | 22.31% | 16.26% | 17.02% | 14.95% | 13.44% | 12.88% | 15.58% | 15.99% | 14.89% | 13.74% | 13.98% | 20.00% | 0.00% | 0.17% | 0.05% | -0.02% | 0.02% | -0.01% | 0.02% | 0.05% | 0.02% | -0.02% | -0.04% | 0.00% |
| EPS | 0.77 | 0.78 | 0.77 | 0.91 | 1.50 | 1.63 | 2.37 | 1.72 | 1.72 | 1.54 | 1.37 | 1.30 | 1.57 | 1.65 | 1.49 | 1.31 | 1.09 | 1.50 | 0.00 | 0.01 | 0.00 | 0.00 | 0.00 | 0.00 | 0.00 | 0.00 | 0.00 | 0.00 | 0.00 | 0.00 |
| EPS Diluted | 0.77 | 0.78 | 0.77 | 0.91 | 1.50 | 1.63 | 2.37 | 1.72 | 1.72 | 1.53 | 1.37 | 1.30 | 1.56 | 1.65 | 1.49 | 1.31 | 1.09 | 1.50 | 0.00 | 0.01 | 0.00 | 0.00 | 0.00 | 0.00 | 0.00 | 0.00 | 0.00 | 0.00 | 0.00 | 0.00 |
| Weighted Avg Shares Out | 2.36B | 2.38B | 2.38B | 2.38B | 2.38B | 2.39B | 2.44B | 2.45B | 2.48B | 2.48B | 2.48B | 2.48B | 2.47B | 2.47B | 2.47B | 2.48B | 2.93B | 2.96B | 3.05B | 3.05B | 3.05B | 3.05B | 3.05B | 3.05B | 2.40B | 2.40B | 2.40B | 2.40B | 2.40B | 2.40B |
| Weighted Avg Shares Out (Dil) | 2.36B | 2.38B | 2.38B | 2.38B | 2.38B | 2.39B | 2.44B | 2.45B | 2.49B | 2.49B | 2.49B | 2.48B | 2.48B | 2.47B | 2.48B | 2.48B | 2.93B | 2.96B | 3.05B | 3.05B | 3.05B | 3.05B | 3.05B | 3.05B | 2.40B | 2.40B | 2.40B | 2.40B | 2.40B | 2.40B |
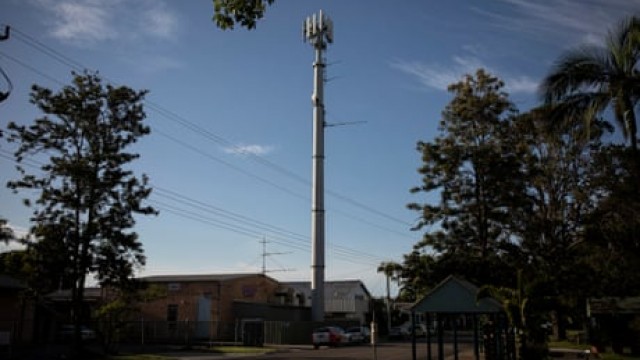
Telstra partners with Elon Musk's Starlink for internet in remote Australia

Telstra-TPG Telecom network sharing deal blocked by Australia's competition tribunal

Telstra: A 4% Tax-Free Dividend From Australia's Largest Telecom Company

Australia's competition watchdog rejects Telstra-TPG network sharing deal

Australia's Telstra suffers privacy breach, 132,000 customers impacted

Australia sues Telstra for not informing customers of downgrade in internet speed

VIV vs. TLSYY: Which Stock Is the Better Value Option?

Australia's Telstra hit by data breach, two weeks after attack on Optus

TU vs. TLSYY: Which Stock Should Value Investors Buy Now?

Telstra to address competition concerns over Optus' 5G roll-out - regulator
Source: https://incomestatements.info
Category: Stock Reports
