See more : Lifan Technology (Group) Co., Ltd. (601777.SS) Income Statement Analysis – Financial Results
Complete financial analysis of Traton SE (TRATF) income statement, including revenue, profit margins, EPS and key performance metrics. Get detailed insights into the financial performance of Traton SE, a leading company in the Agricultural – Machinery industry within the Industrials sector.
- Alliance Global Group, Inc. (ALGGF) Income Statement Analysis – Financial Results
- Grand Venture Technology Limited (JLB.SI) Income Statement Analysis – Financial Results
- IMP Powers Limited (INDLMETER.NS) Income Statement Analysis – Financial Results
- Lippo Limited (0226.HK) Income Statement Analysis – Financial Results
- Shandong Longji Machinery Co.,Ltd (002363.SZ) Income Statement Analysis – Financial Results
Traton SE (TRATF)
About Traton SE
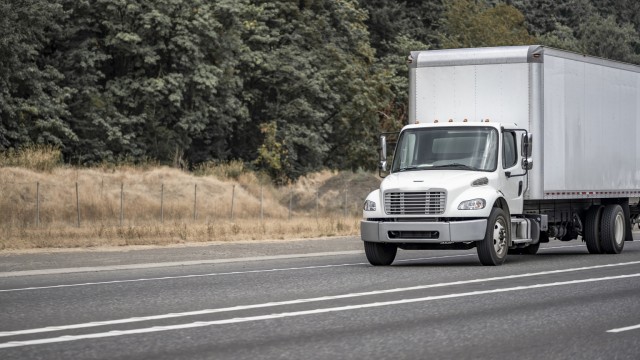
Traton SE manufactures commercial vehicles worldwide. It operates in Industrial Business and Financial Services segments. The company offers light and heavy-duty commercial vehicles, such as trucks and bus chassis; vans; construction vehicles; city buses; and intercity and travel coaches, as well as spare parts and services. It also provides a cloud-based platform for freight transportation under the RIO brand name. The company offers its products and services under the MAN, Scania, Navistar, and Volkswagen Caminhões e Ônibus brands. In addition, it provides a range of financial solutions, including dealer and customer finance, leasing, and insurance products. The company was founded in 2015 and is based in Munich, Germany. Traton SE is a subsidiary of Volkswagen Finance Luxemburg S.A.
| Metric | 2023 | 2022 | 2021 | 2020 | 2019 | 2018 | 2017 | 2016 |
|---|---|---|---|---|---|---|---|---|
| Revenue | 46.87B | 40.34B | 30.62B | 22.58B | 26.90B | 25.93B | 24.37B | 21.92B |
| Cost of Revenue | 37.63B | 33.48B | 25.08B | 19.12B | 21.62B | 20.95B | 19.88B | 17.89B |
| Gross Profit | 9.24B | 6.85B | 5.54B | 3.46B | 5.28B | 4.98B | 4.49B | 4.03B |
| Gross Profit Ratio | 19.72% | 16.99% | 18.08% | 15.32% | 19.64% | 19.21% | 18.42% | 18.38% |
| Research & Development | 0.00 | 1.30B | 1.00B | 849.00M | 909.00M | 962.00M | 1.01B | 911.00M |
| General & Administrative | 1.52B | 1.38B | 1.20B | 876.00M | 942.00M | 943.00M | 872.00M | 789.00M |
| Selling & Marketing | 3.60B | 3.40B | 2.76B | 2.25B | 2.48B | 2.39B | 2.35B | 2.32B |
| SG&A | 5.12B | 4.78B | 3.96B | 3.12B | 3.42B | 3.33B | 1.99B | 1.96B |
| Other Expenses | 357.00M | 36.00M | 20.00M | 16.00M | 16.00M | 19.00M | 66.00M | -328.00M |
| Operating Expenses | 5.48B | 4.62B | 4.21B | 3.17B | 3.23B | 3.34B | 2.93B | 3.20B |
| Cost & Expenses | 43.11B | 38.10B | 29.29B | 22.29B | 24.85B | 24.29B | 22.81B | 21.08B |
| Interest Income | 341.00M | 235.00M | 122.00M | 70.00M | 93.00M | 83.00M | 136.00M | 184.00M |
| Interest Expense | 887.00M | 459.00M | 348.00M | 227.00M | 262.00M | 245.00M | 0.00 | 0.00 |
| Depreciation & Amortization | 2.86B | 2.95B | 2.61B | 2.44B | 2.20B | 1.90B | 1.94B | 1.87B |
| EBITDA | 7.00B | 5.00B | 3.73B | 2.63B | 4.43B | 3.71B | 3.50B | 2.70B |
| EBITDA Ratio | 14.94% | 14.21% | 14.86% | 11.24% | 17.44% | 15.29% | 14.34% | 12.32% |
| Operating Income | 3.76B | 1.56B | 393.00M | 81.00M | 1.88B | 1.51B | 1.55B | 833.00M |
| Operating Income Ratio | 8.03% | 3.88% | 1.28% | 0.36% | 7.00% | 5.84% | 6.37% | 3.80% |
| Total Other Income/Expenses | -510.00M | -723.00M | -658.00M | -115.00M | 80.00M | 53.00M | -175.00M | -649.00M |
| Income Before Tax | 3.25B | 1.56B | 648.00M | -34.00M | 1.97B | 1.57B | 1.31B | 476.00M |
| Income Before Tax Ratio | 6.94% | 3.87% | 2.12% | -0.15% | 7.30% | 6.04% | 5.36% | 2.17% |
| Income Tax Expense | 802.00M | 419.00M | 178.00M | 89.00M | 401.00M | 415.00M | 489.00M | 297.00M |
| Net Income | 2.45B | 1.14B | 457.00M | -101.00M | 1.52B | 1.39B | 1.03B | 208.00M |
| Net Income Ratio | 5.23% | 2.83% | 1.49% | -0.45% | 5.64% | 5.36% | 4.22% | 0.95% |
| EPS | 4.90 | 2.28 | 0.91 | -0.20 | 3.04 | 2.78 | 17.90 | 3.62 |
| EPS Diluted | 4.90 | 2.28 | 0.91 | -0.20 | 3.04 | 2.78 | 17.90 | 3.62 |
| Weighted Avg Shares Out | 500.00M | 500.00M | 500.00M | 500.00M | 500.00M | 500.00M | 57.50M | 57.50M |
| Weighted Avg Shares Out (Dil) | 500.00M | 500.00M | 500.00M | 500.00M | 500.00M | 500.00M | 57.50M | 57.50M |

It's All About Capacity In The Truck Market

Truckmaker MAN to raise prices to tackle energy, raw material inflation

Trucks Spinoffs No. 3: Traton's Fight For Margins

Brazil's Tupy set to buy Traton-owned motor maker MWM, shares soar

Navistar owner Traton upsizes electrification spend to nearly $3B by 2026
Source: https://incomestatements.info
Category: Stock Reports
