See more : Grupo Aval Acciones y Valores S.A. (AVAL) Income Statement Analysis – Financial Results
Complete financial analysis of Tourmaline Oil Corp. (TRMLF) income statement, including revenue, profit margins, EPS and key performance metrics. Get detailed insights into the financial performance of Tourmaline Oil Corp., a leading company in the Oil & Gas Exploration & Production industry within the Energy sector.
- Hengxin Shambala Culture Co.,Ltd. (300081.SZ) Income Statement Analysis – Financial Results
- Career Point Limited (CAREERP.BO) Income Statement Analysis – Financial Results
- SSC Security Services Corp. (SECUF) Income Statement Analysis – Financial Results
- Jia Wei Lifestyle, Inc. (3557.TW) Income Statement Analysis – Financial Results
- Nippon Accommodations Fund Inc. (NIPPF) Income Statement Analysis – Financial Results
Tourmaline Oil Corp. (TRMLF)
About Tourmaline Oil Corp.
Tourmaline Oil Corp. acquires, explores for, develops, and produces oil and natural gas properties in the Western Canadian Sedimentary Basin. It holds interests in properties located in the Alberta Deep Basin, Northeast British Columbia Montney, and the Peace River High Triassic oil complex. The company was incorporated in 2008 and is headquartered in Calgary, Canada.
| Metric | 2023 | 2022 | 2021 | 2020 | 2019 | 2018 | 2017 | 2016 | 2015 | 2014 | 2013 | 2012 | 2011 | 2010 | 2009 |
|---|---|---|---|---|---|---|---|---|---|---|---|---|---|---|---|
| Revenue | 4.84B | 8.68B | 5.12B | 2.14B | 2.14B | 2.16B | 1.66B | 1.12B | 1.07B | 1.38B | 759.15M | 441.89M | 348.65M | 212.41M | 39.91M |
| Cost of Revenue | 1.89B | 2.34B | 1.28B | 1.25B | 969.75M | 899.53M | 868.24M | 715.04M | 737.49M | 636.18M | 413.74M | 272.83M | 110.07M | 68.34M | 14.75M |
| Gross Profit | 2.95B | 6.33B | 3.84B | 892.18M | 1.17B | 1.26B | 793.34M | 409.48M | 336.47M | 743.21M | 345.41M | 169.06M | 238.59M | 144.07M | 25.15M |
| Gross Profit Ratio | 61.00% | 73.00% | 74.95% | 41.61% | 54.63% | 58.39% | 47.75% | 36.41% | 31.33% | 53.88% | 45.50% | 38.26% | 68.43% | 67.83% | 63.03% |
| Research & Development | 0.00 | 0.00 | 0.00 | 0.00 | 0.00 | 0.00 | 0.00 | 0.00 | 0.00 | 0.00 | 0.00 | 0.00 | 0.00 | 0.00 | 0.00 |
| General & Administrative | 123.63M | 1.03B | 787.43M | 583.59M | 476.01M | 405.94M | 318.91M | 217.05M | 170.78M | 132.49M | 96.18M | 64.27M | 23.18M | 10.03M | 4.11M |
| Selling & Marketing | 54.90M | 0.00 | 0.00 | 48.00M | 33.34M | 23.50M | 13.35M | 164.02M | 114.63M | 78.81M | 56.63M | 34.71M | 23.38M | 0.00 | 0.00 |
| SG&A | 178.52M | 1.03B | 787.43M | 583.59M | 476.01M | 405.94M | 318.91M | 217.05M | 170.78M | 132.49M | 96.18M | 64.27M | 23.18M | 10.03M | 4.11M |
| Other Expenses | 529.37M | 53.41M | 45.73M | 39.91M | 0.00 | 0.00 | 31.93M | 25.79M | 28.94M | 17.73M | 6.33M | 4.90M | 0.00 | 0.00 | 0.00 |
| Operating Expenses | 707.90M | 1.78B | 1.36B | 905.77M | 794.14M | 701.51M | 574.82M | 419.66M | 391.16M | 317.74M | 210.56M | 143.01M | 181.35M | 137.01M | 27.13M |
| Cost & Expenses | 2.60B | 4.13B | 2.64B | 2.16B | 1.76B | 1.60B | 1.44B | 1.13B | 1.13B | 953.92M | 624.31M | 415.84M | 291.41M | 205.35M | 41.89M |
| Interest Income | 0.00 | 4.42M | 13.56M | 80.24M | 66.94M | 0.00 | 0.00 | 140.00K | 235.00K | 243.00K | 193.00K | 138.00K | 304.00K | 0.00 | 0.00 |
| Interest Expense | 38.19M | 29.94M | 36.59M | 42.13M | 59.15M | 48.91M | 44.29M | 40.55M | 36.68M | 24.63M | 12.22M | 10.48M | 3.87M | 1.09M | 53.00K |
| Depreciation & Amortization | 1.30B | 1.21B | 858.40M | 1.14B | 859.25M | 804.28M | 779.59M | 669.79M | 690.86M | 515.99M | 356.24M | 242.53M | 158.17M | 126.99M | 23.02M |
| EBITDA | 3.52B | 7.12B | 3.41B | 1.80B | 1.21B | 1.38B | 1.28B | 642.86M | 889.49M | 1.23B | 586.83M | 285.65M | 230.48M | 124.31M | 21.04M |
| EBITDA Ratio | 72.75% | 66.48% | 65.07% | 52.46% | 57.40% | 62.88% | 59.75% | 58.35% | 59.26% | 68.27% | 64.71% | 60.81% | 61.78% | 63.11% | 52.73% |
| Operating Income | 2.24B | 5.96B | 2.59B | 675.30M | 362.73M | 624.16M | 551.56M | 12.64M | 206.58M | 713.63M | 233.73M | 45.60M | 74.61M | 22.24M | -1.98M |
| Operating Income Ratio | 46.37% | 68.66% | 50.58% | 31.50% | 16.97% | 28.87% | 33.19% | 1.12% | 19.24% | 51.74% | 30.79% | 10.32% | 21.40% | 10.47% | -4.96% |
| Total Other Income/Expenses | -64.97M | -51.53M | -66.86M | -55.81M | -63.84M | -57.09M | -52.73M | -48.66M | -44.63M | -29.03M | -15.36M | -3.96M | -6.18M | -2.77M | -53.00K |
| Income Before Tax | 2.18B | 5.91B | 2.52B | 619.48M | 298.89M | 567.07M | 498.83M | -36.02M | 161.95M | 685.15M | 218.38M | 32.64M | 68.43M | 21.15M | -2.03M |
| Income Before Tax Ratio | 45.03% | 68.06% | 49.27% | 28.89% | 13.99% | 26.23% | 30.02% | -3.20% | 15.08% | 49.67% | 28.77% | 7.39% | 19.63% | 9.96% | -5.09% |
| Income Tax Expense | 443.49M | 1.42B | 494.02M | 931.00K | -21.14M | 165.40M | 151.79M | -3.17M | 83.44M | 184.15M | 68.68M | 15.90M | 24.58M | 6.36M | 61.00K |
| Net Income | 1.74B | 4.49B | 2.03B | 618.31M | 319.74M | 401.42M | 346.77M | -31.97M | 80.09M | 488.87M | 148.11M | 15.52M | 42.68M | 14.55M | -2.12M |
| Net Income Ratio | 35.87% | 51.71% | 39.56% | 28.84% | 14.96% | 18.57% | 20.87% | -2.84% | 7.46% | 35.44% | 19.51% | 3.51% | 12.24% | 6.85% | -5.31% |
| EPS | 5.03 | 13.37 | 6.49 | 2.27 | 1.18 | 1.48 | 1.29 | -0.14 | 0.37 | 2.46 | 0.81 | 0.10 | 0.29 | 0.12 | -0.03 |
| EPS Diluted | 5.03 | 13.10 | 6.40 | 2.27 | 1.18 | 1.48 | 1.29 | -0.14 | 0.37 | 2.41 | 0.79 | 0.09 | 0.28 | 0.12 | -0.03 |
| Weighted Avg Shares Out | 345.11M | 335.60M | 311.97M | 272.01M | 271.79M | 271.70M | 269.59M | 228.36M | 213.82M | 199.01M | 183.71M | 162.56M | 146.65M | 120.79M | 68.46M |
| Weighted Avg Shares Out (Dil) | 345.38M | 342.53M | 316.79M | 272.08M | 271.88M | 271.70M | 269.60M | 233.93M | 214.77M | 202.78M | 188.24M | 167.03M | 152.32M | 123.39M | 68.46M |

Tourmaline Oil: Keep Waiting For A More Attractive Entry Point

Not A Banana: 2 (Special) Dividend Stocks Offering Ultra-Deep Value
Tourmaline Oil price target lowered to C$77 from C$79 at Desjardins

If You Like Special Dividends, You'll Love Tourmaline
Tourmaline Oil to buy Crew Energy for $1.3B, boosting Montney presence
Tourmaline Oil to acquire Crew Energy for $947 million

My Favorites! 3 Highly Attractive Stocks For The Natural Gas-Fueled AI Boom
Tourmaline Oil: A Must Have Low-Cost Natural Gas Producer Paying Special Dividends
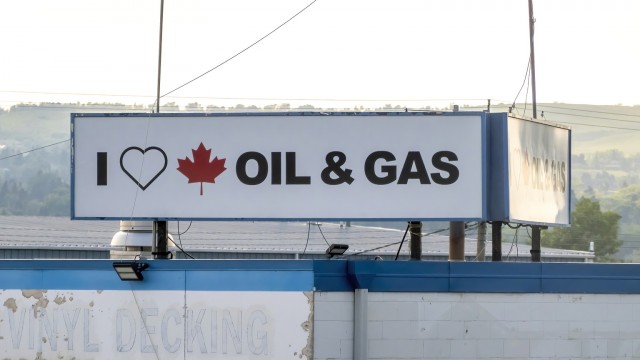
Tourmaline Oil: One Of The Best Natural Gas Companies Out There
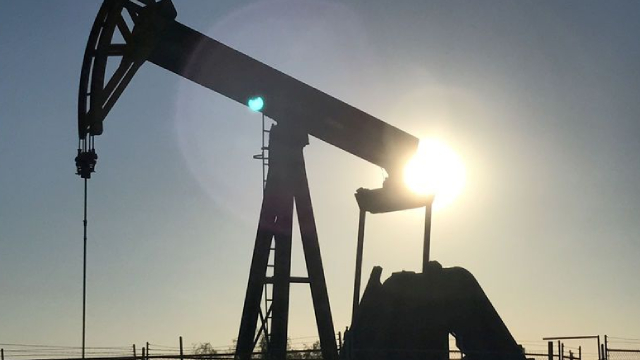
Tourmaline Oil to buy Bonavista Energy for $1.06 bln
Source: https://incomestatements.info
Category: Stock Reports
