See more : Zscaler, Inc. (ZS) Income Statement Analysis – Financial Results
Complete financial analysis of Tesla, Inc. (TSLA) income statement, including revenue, profit margins, EPS and key performance metrics. Get detailed insights into the financial performance of Tesla, Inc., a leading company in the Auto – Manufacturers industry within the Consumer Cyclical sector.
- Affinity Networks, Inc. (AFFN) Income Statement Analysis – Financial Results
- Landcadia Holdings IV, Inc. (LCA) Income Statement Analysis – Financial Results
- Tomoe Corporation (1921.T) Income Statement Analysis – Financial Results
- Liverpool Group, Inc. (LVRP) Income Statement Analysis – Financial Results
- MedTech Acquisition Corporation (MTACU) Income Statement Analysis – Financial Results
Tesla, Inc. (TSLA)
About Tesla, Inc.
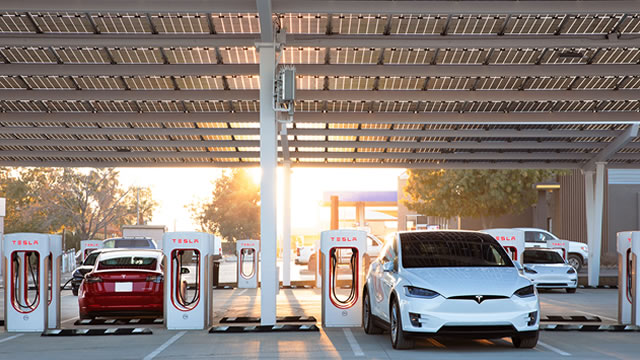
Tesla, Inc. designs, develops, manufactures, leases, and sells electric vehicles, and energy generation and storage systems in the United States, China, and internationally. It operates in two segments, Automotive, and Energy Generation and Storage. The Automotive segment offers electric vehicles, as well as sells automotive regulatory credits; and non-warranty after-sales vehicle, used vehicles, retail merchandise, and vehicle insurance services. This segment also provides sedans and sport utility vehicles through direct and used vehicle sales, a network of Tesla Superchargers, and in-app upgrades; purchase financing and leasing services; services for electric vehicles through its company-owned service locations and Tesla mobile service technicians; and vehicle limited warranties and extended service plans. The Energy Generation and Storage segment engages in the design, manufacture, installation, sale, and leasing of solar energy generation and energy storage products, and related services to residential, commercial, and industrial customers and utilities through its website, stores, and galleries, as well as through a network of channel partners; and provision of service and repairs to its energy product customers, including under warranty, as well as various financing options to its solar customers. The company was formerly known as Tesla Motors, Inc. and changed its name to Tesla, Inc. in February 2017. Tesla, Inc. was incorporated in 2003 and is headquartered in Austin, Texas.
| Metric | 2023 | 2022 | 2021 | 2020 | 2019 | 2018 | 2017 | 2016 | 2015 | 2014 | 2013 | 2012 | 2011 | 2010 | 2009 | 2008 | 2007 | 2006 |
|---|---|---|---|---|---|---|---|---|---|---|---|---|---|---|---|---|---|---|
| Revenue | 96.77B | 81.46B | 53.82B | 31.54B | 24.58B | 21.46B | 11.76B | 7.00B | 4.05B | 3.20B | 2.01B | 413.26M | 204.24M | 116.74M | 111.94M | 14.74M | 73.00K | 0.00 |
| Cost of Revenue | 79.11B | 60.61B | 40.22B | 24.91B | 20.51B | 17.42B | 9.54B | 5.40B | 3.12B | 2.32B | 1.56B | 383.19M | 142.65M | 86.01M | 102.41M | 15.88M | 9.00K | 615.00K |
| Gross Profit | 17.66B | 20.85B | 13.61B | 6.63B | 4.07B | 4.04B | 2.22B | 1.60B | 923.50M | 881.67M | 456.26M | 30.07M | 61.60M | 30.73M | 9.54M | -1.14M | 64.00K | -615.00K |
| Gross Profit Ratio | 18.25% | 25.60% | 25.28% | 21.02% | 16.56% | 18.83% | 18.90% | 22.85% | 22.82% | 27.57% | 22.66% | 7.28% | 30.16% | 26.32% | 8.52% | -7.74% | 87.67% | 0.00% |
| Research & Development | 3.97B | 3.08B | 2.59B | 1.49B | 1.34B | 1.46B | 1.38B | 834.41M | 717.90M | 464.70M | 231.98M | 273.98M | 208.98M | 93.00M | 19.28M | 53.71M | 62.75M | 25.00M |
| General & Administrative | 0.00 | 0.00 | 0.00 | 0.00 | 0.00 | 0.00 | 2.44B | 1.38B | 863.93M | 554.76M | 276.57M | 146.47M | 0.00 | 0.00 | 0.00 | 0.00 | 0.00 | 0.00 |
| Selling & Marketing | 0.00 | 0.00 | 0.00 | 0.00 | 0.00 | 0.00 | 37.00M | 48.00M | 58.30M | 48.90M | 9.00M | 3.90M | 0.00 | 0.00 | 0.00 | 0.00 | 0.00 | 0.00 |
| SG&A | 4.80B | 3.95B | 4.52B | 3.15B | 2.65B | 2.84B | 2.48B | 1.43B | 922.23M | 603.66M | 285.57M | 150.37M | 104.10M | 84.57M | 42.15M | 23.65M | 17.24M | 4.82M |
| Other Expenses | 0.00 | 0.00 | 0.00 | 0.00 | 0.00 | 0.00 | 0.00 | 0.00 | 0.00 | 0.00 | 0.00 | 0.00 | 0.00 | 0.00 | 0.00 | 0.00 | 0.00 | 0.00 |
| Operating Expenses | 8.77B | 7.02B | 7.11B | 4.64B | 3.99B | 4.30B | 3.86B | 2.27B | 1.64B | 1.07B | 517.55M | 424.35M | 313.08M | 177.57M | 61.43M | 77.36M | 80.00M | 29.82M |
| Cost & Expenses | 87.88B | 67.63B | 47.33B | 29.54B | 24.50B | 21.71B | 13.39B | 7.67B | 4.76B | 3.39B | 2.07B | 807.54M | 455.73M | 263.58M | 163.84M | 93.25M | 80.01M | 30.43M |
| Interest Income | 1.07B | 297.00M | 56.00M | 30.00M | 44.00M | 24.00M | 19.00M | 8.53M | 1.51M | 1.13M | 189.00K | 288.00K | 255.00K | 258.00K | 159.00K | 529.00K | 1.75M | 938.00K |
| Interest Expense | 156.00M | 191.00M | 371.00M | 748.00M | 685.00M | 663.00M | 471.00M | 198.81M | 118.85M | 100.89M | 32.93M | 254.00K | 43.00K | 992.00K | 2.53M | 3.75M | 0.00 | 423.00K |
| Depreciation & Amortization | 4.67B | 3.75B | 2.91B | 2.32B | 2.09B | 1.90B | 1.64B | 947.10M | 422.59M | 231.93M | 106.08M | 28.83M | 16.92M | 10.62M | 6.94M | 4.16M | 2.90M | 615.00K |
| EBITDA | 14.80B | 17.40B | 9.63B | 4.27B | 2.17B | 1.56B | -101.77M | 399.56M | -334.18M | 48.18M | 56.79M | -367.00M | -236.96M | -142.54M | -46.24M | -74.78M | -75.15M | -28.82M |
| EBITDA Ratio | 15.29% | 21.36% | 17.53% | 13.39% | 8.84% | 7.27% | -0.87% | 4.31% | -8.26% | 0.45% | 2.22% | -88.81% | -116.02% | -122.10% | -41.31% | -507.26% | -103,135.62% | 0.00% |
| Operating Income | 8.89B | 13.66B | 6.52B | 1.99B | -69.00M | -388.00M | -1.63B | -667.34M | -716.63M | -186.69M | -61.28M | -394.28M | -251.49M | -146.84M | -51.90M | -78.50M | -79.93M | -30.43M |
| Operating Income Ratio | 9.19% | 16.76% | 12.12% | -6.32% | 0.28% | -1.81% | -13.88% | -9.53% | -17.71% | -5.84% | -3.04% | -95.41% | -123.13% | -125.78% | -46.36% | -532.52% | -109,497.26% | 0.00% |
| Total Other Income/Expenses | 1.08B | 63.00M | -180.00M | -840.00M | -596.00M | -617.00M | -577.00M | -79.01M | -159.00M | -97.95M | -10.14M | -1.79M | -2.43M | -7.32M | -3.82M | -4.18M | 1.89M | 574.00K |
| Income Before Tax | 9.97B | 13.72B | 6.34B | 1.15B | -665.00M | -1.01B | -2.21B | -746.35M | -875.62M | -284.64M | -71.43M | -396.08M | -253.92M | -154.16M | -55.71M | -82.69M | -78.05M | -29.86M |
| Income Before Tax Ratio | 10.31% | 16.84% | 11.78% | 3.66% | -2.71% | -4.68% | -18.79% | -10.66% | -21.64% | -8.90% | -3.55% | -95.84% | -124.32% | -132.05% | -49.77% | -560.88% | -106,913.70% | 0.00% |
| Income Tax Expense | -5.00B | 1.13B | 699.00M | 292.00M | 110.00M | 58.00M | 32.00M | 26.70M | 13.04M | 9.40M | 2.59M | 136.00K | 489.00K | 173.00K | 26.00K | 97.00K | 110.00K | 100.00K |
| Net Income | 15.00B | 12.58B | 5.52B | 721.00M | -862.00M | -976.00M | -1.96B | -674.91M | -888.66M | -294.04M | -74.01M | -396.21M | -254.41M | -154.33M | -55.74M | -82.78M | -78.16M | -29.96M |
| Net Income Ratio | 15.50% | 15.45% | 10.26% | 2.29% | -3.51% | -4.55% | -16.69% | -9.64% | -21.96% | -9.19% | -3.68% | -95.88% | -124.56% | -132.19% | -49.79% | -561.54% | -107,064.38% | 0.00% |
| EPS | 4.73 | 4.02 | 1.87 | 0.25 | -0.33 | -0.38 | -0.79 | -0.31 | -0.46 | -0.16 | -0.04 | -0.25 | -0.17 | -0.20 | -0.03 | -0.04 | -0.04 | -0.01 |
| EPS Diluted | 4.30 | 3.62 | 1.63 | 0.21 | -0.33 | -0.38 | -0.79 | -0.31 | -0.46 | -0.16 | -0.04 | -0.25 | -0.17 | -0.20 | -0.03 | -0.04 | -0.04 | -0.01 |
| Weighted Avg Shares Out | 3.17B | 3.13B | 2.96B | 2.88B | 2.66B | 2.56B | 2.49B | 2.16B | 1.92B | 1.87B | 1.79B | 1.61B | 1.51B | 760.77M | 2.04B | 2.04B | 2.04B | 1.40B |
| Weighted Avg Shares Out (Dil) | 3.49B | 3.48B | 3.39B | 2.88B | 2.66B | 2.56B | 2.49B | 2.16B | 1.92B | 1.87B | 1.79B | 1.61B | 1.51B | 760.77M | 2.04B | 2.04B | 2.04B | 1.40B |

Wall St Can't Find a Single Reason the EV Business Will Improve Next Year. Rivian, Tesla, and Lucid Are on Watch (RIVN, TSLA, LCID)

Nasdaq 100: Tesla's Gains and Intel's Shake-Up Shape Premarket Trends

Tesla Stock Rises Amid Huge Price Target. This Is What's Exciting Wall Street.

How will Elon Musk's plans to slash the U.S. budget affect Tesla?

Tesla's stock gets a boost from awaited update to Full Self-Driving software

Analyst revises Tesla stock price target as ‘clearer path to FSD' emerges

US Stocks To Edge Lower After Thanksgiving As Investors Await Data: Analyst Expects A Santa Rally Thanks To 'Goldilocks Foundation' For Big Tech And Tesla Going Into 2025

Tesla and BYD Are at It Again. Why the EV Makers Are Offering Big Discounts.

Tesla leads November's global market value surge

Better Stock Under the Trump Administration: Palantir or Tesla?
Source: https://incomestatements.info
Category: Stock Reports
