See more : Centro de Imagem Diagnósticos S.A. (AALR3.SA) Income Statement Analysis – Financial Results
Complete financial analysis of UAV Corp. (UMAV) income statement, including revenue, profit margins, EPS and key performance metrics. Get detailed insights into the financial performance of UAV Corp., a leading company in the Aerospace & Defense industry within the Industrials sector.
- Toast, Inc. (TOST) Income Statement Analysis – Financial Results
- PSP Swiss Property AG (PSPSF) Income Statement Analysis – Financial Results
- Com7 Public Company Limited (COM7.BK) Income Statement Analysis – Financial Results
- Chinese Universe Publishing and Media Group Co., Ltd. (600373.SS) Income Statement Analysis – Financial Results
- CymaBay Therapeutics, Inc. (CBAY) Income Statement Analysis – Financial Results
UAV Corp. (UMAV)
About UAV Corp.
UAV Corp., through its subsidiary Skyborne Technology, Inc., invests in research and development of intellectual property and proprietary designs in areas covering semi-rigid airship design, reverse-ballonet technology, and mooring and hybrid propulsion. It offers SENTINEL, a man portable communication network between wired and Wi-Fi enabled devices for defense and emergency management applications, as well as offers a command, control, and communication network in response to various circumstances, including weather, natural disasters, power outages, and hostile attacks. The company was formerly known as Han Tang Technology, Inc. and changed its name to UAV Corp. in January 2021. UAV Corp. was founded in 1987 and is headquartered in Wewahitchka, Florida.
| Metric | 2023 | 2022 | 2021 | 2020 | 2019 | 2018 | 2017 | 2015 | 2014 |
|---|---|---|---|---|---|---|---|---|---|
| Revenue | 0.00 | 0.00 | 594.98K | 297.92K | 0.00 | 0.00 | 0.00 | 0.00 | 0.00 |
| Cost of Revenue | 27.32K | 27.32K | 339.64K | 181.99K | 0.00 | 0.00 | 0.00 | 0.00 | 0.00 |
| Gross Profit | -27.32K | -27.32K | 255.34K | 115.93K | 0.00 | 0.00 | 0.00 | 0.00 | 0.00 |
| Gross Profit Ratio | 0.00% | 0.00% | 42.92% | 38.91% | 0.00% | 0.00% | 0.00% | 0.00% | 0.00% |
| Research & Development | 0.00 | 0.00 | 0.00 | 0.00 | 0.00 | 75.70 | 0.00 | 0.00 | 0.00 |
| General & Administrative | 0.00 | 0.00 | 0.00 | 220.49 | 70.99 | 116.62 | 0.00 | 12.33 | 1.29 |
| Selling & Marketing | 0.00 | 0.00 | 0.00 | 514.23K | 9.62 | 28.77K | 0.00 | 5.26 | 0.99 |
| SG&A | 654.28K | 2.84M | 567.48K | 514.45K | 80.60 | 28.88K | 24.07K | 17.59 | 2.28 |
| Other Expenses | 0.00 | 0.00 | 0.00 | 0.00 | 0.00 | 0.00 | 0.00 | 0.00 | 0.00 |
| Operating Expenses | 654.28K | 2.84M | 567.48K | 514.45K | 2.93K | 28.88K | 24.07K | 17.59 | 2.28 |
| Cost & Expenses | 681.61K | 2.87M | 907.13K | 696.44K | 2.93K | 28.88K | 24.07K | 17.59 | 2.28 |
| Interest Income | 0.00 | 0.00 | 0.00 | 0.00 | 222.93 | 0.00 | 0.00 | 0.85 | 0.07 |
| Interest Expense | 235.54K | 280.82K | 252.48K | 591.41K | 0.00 | 10.17K | 2.73K | 0.00 | 0.00 |
| Depreciation & Amortization | 27.32K | 27.32K | 28.57K | 29.82K | 2.50 | 2.50 | 52.52K | 17.59 | 2.28 |
| EBITDA | -726.50K | -2.87M | -452.96K | -545.20K | -89.31 | -28.88K | -24.06K | -0.85 | -0.07 |
| EBITDA Ratio | 0.00% | 0.00% | -47.66% | -123.76% | 0.00% | 0.00% | 0.00% | 0.00% | 0.00% |
| Operating Income | -681.61K | -2.87M | -312.14K | -398.52K | -91.81 | -28.88K | -24.06K | -17.59 | -2.28 |
| Operating Income Ratio | 0.00% | 0.00% | -52.46% | -133.77% | 0.00% | 0.00% | 0.00% | 0.00% | 0.00% |
| Total Other Income/Expenses | -307.76K | -308.42K | -421.87K | -767.92K | -3.06K | -10.18K | -2.74K | -0.85 | -0.07 |
| Income Before Tax | -989.37K | -3.18M | -734.02K | -1.17M | -3.15K | -39.06K | -26.80K | -18.44 | -2.35 |
| Income Before Tax Ratio | 0.00% | 0.00% | -123.37% | -391.53% | 0.00% | 0.00% | 0.00% | 0.00% | 0.00% |
| Income Tax Expense | -4.00 | -5.00 | 1.00 | -4.00 | 0.00 | -161.14K | -52.52K | -0.85 | -0.07 |
| Net Income | -989.37K | -3.18M | -734.02K | -1.17M | -3.15K | -39.06K | -26.80K | -18.44 | -2.35 |
| Net Income Ratio | 0.00% | 0.00% | -123.37% | -391.53% | 0.00% | 0.00% | 0.00% | 0.00% | 0.00% |
| EPS | -0.01 | -0.06 | -0.08 | -0.22 | -0.68 | -0.01 | -0.01 | -0.09 | -0.01 |
| EPS Diluted | -0.01 | -0.06 | -0.08 | -0.22 | -0.68 | -0.01 | -0.01 | -0.09 | -0.01 |
| Weighted Avg Shares Out | 91.72M | 50.72M | 9.56M | 5.23M | 4.67K | 4.56M | 4.53M | 204.00 | 204.00 |
| Weighted Avg Shares Out (Dil) | 91.72M | 50.72M | 9.56M | 5.23M | 4.67K | 4.56M | 4.53M | 204.71 | 204.71 |

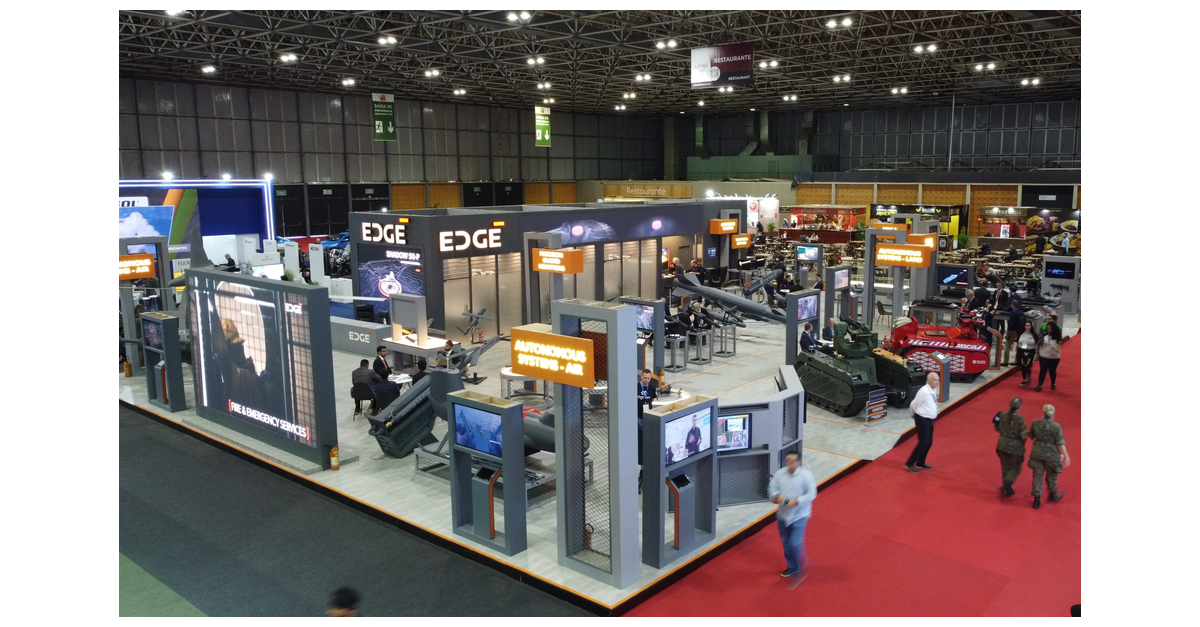
EDGE Reinforces Presence in Southeast Asia with Impressive Product Display at LIMA 2023

AdvisorShares Targets Drone Tech and Bitcoin Futures With UAV and CRYP ETFs

UAV CORP (UMAV) ANNOUNCES SUCCESSFUL PRE-FLIGHT TESTING OF AWERX, THE U.S. AIR FORCE PROTOTYPE DATT MA 600 HYBRID ELECTRIC AIRSHIP

UAV Corp's Subsidiary Skyborne Technology and Gulf Coast State College Execute Phase II Binding MOU

UAV Corp (UMAV) subsidiary, Research in Flight (RIF), and Auburn University receives 1st phase of Air Force AWERX contract for an Electric Extended Range Airship with Modular Payload (e(2)RAMP)

Fortress UAV Announces New Services for OEMs, Enterprises and Public Safety Agencies

Fortress UAV Releases New Drone Field Repair Kits for Public Safety and Enterprise Drone Operators

Orbital UAV books full-year profit as revenues surge, shares up 300% in 2020 - Stockhead

Orbital meets with federal Defence Minister as government flags $2bn in UAV investments - Stockhead
Source: https://incomestatements.info
Category: Stock Reports

