See more : Global Industrial Company (GIC) Income Statement Analysis – Financial Results
Complete financial analysis of Voestalpine AG (VLPNY) income statement, including revenue, profit margins, EPS and key performance metrics. Get detailed insights into the financial performance of Voestalpine AG, a leading company in the Steel industry within the Basic Materials sector.
- Capstead Mortgage Corporation (CMO) Income Statement Analysis – Financial Results
- Kalyani Forge Limited (KALYANIFRG.NS) Income Statement Analysis – Financial Results
- Celadon Pharmaceuticals Plc (CEL.L) Income Statement Analysis – Financial Results
- Tikkurila Oyj (0MFI.L) Income Statement Analysis – Financial Results
- Sats ASA (SATS.OL) Income Statement Analysis – Financial Results
Voestalpine AG (VLPNY)
About Voestalpine AG
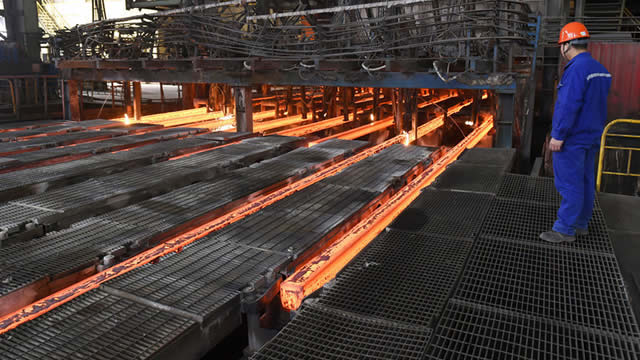
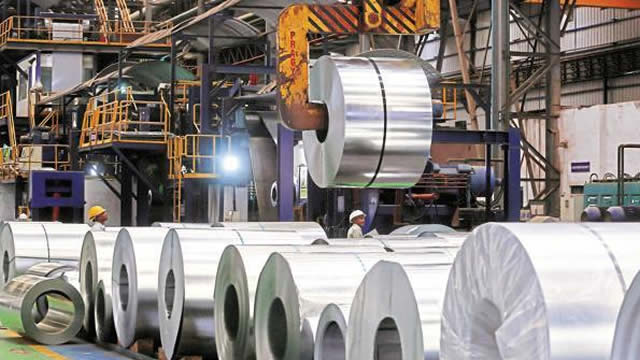
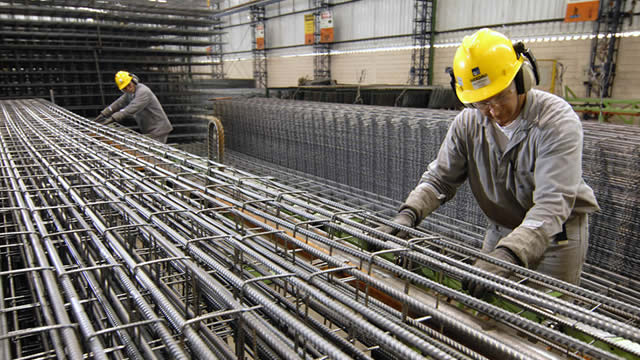
Voestalpine AG processes, develops, manufactures, and sells steel products in Austria, European Union, and internationally. The company operates through five segments: Steel, High Performance Metals, Metal Engineering, Metal Forming, and Other. The Steel division produces hot and cold-rolled steel strips, as well as electrogalvanized, hot-dip galvanized, and organically coated steel strips; and heavy plates for the energy sector, as well as turbine casings for automotive, white goods/consumer goods, building/construction, energy, mechanical engineering, and others. The High Performance Metals segment offers special alloys for the oil and natural gas, aerospace, and energy engineering industries; tool manufacturing, component processing, heat treatment, and coating services; and warehousing and preprocessing of special steels, as well as services, including logistics, distribution, and processing for the oil and natural gas industries for automotive, white goods/consumer goods, building/construction, aerospace, mechanical engineering, and others. The Metal Engineering division offers rails and turnout products, rod and drawn wires, seamless tubes, and welding consumables and machinery; rails and digital monitoring systems; and services for rail infrastructure. This segment serves railway systems, automotive, white goods/consumer goods, building/construction, energy, mechanical engineering, and others. The Metal Forming division manufactures special tubes and sections, and precision strip steel products, as well as pre-finished system components made from pressed, stamped, and roll-profiled parts for use in automotive, white goods/consumer goods, building/construction, energy, mechanical engineering, and others. The company is headquartered in Linz, Austria.
| Metric | 2024 | 2023 | 2022 | 2021 | 2020 | 2019 | 2018 | 2017 | 2016 | 2015 | 2014 | 2013 | 2012 | 2011 | 2010 | 2009 | 2008 | 2007 | 2006 | 2005 |
|---|---|---|---|---|---|---|---|---|---|---|---|---|---|---|---|---|---|---|---|---|
| Revenue | 16.68B | 18.23B | 14.92B | 11.27B | 12.72B | 13.56B | 12.90B | 11.29B | 11.07B | 11.19B | 11.23B | 11.52B | 12.06B | 10.95B | 8.55B | 11.63B | 10.48B | 7.05B | 6.23B | 5.78B |
| Cost of Revenue | 13.89B | 14.59B | 11.56B | 9.41B | 10.56B | 10.78B | 9.92B | 8.78B | 8.63B | 8.92B | 8.94B | 9.22B | 9.61B | 8.52B | 6.88B | 9.14B | 7.98B | 5.24B | 4.78B | 4.55B |
| Gross Profit | 2.79B | 3.64B | 3.36B | 1.85B | 2.16B | 2.78B | 2.97B | 2.52B | 2.44B | 2.27B | 2.29B | 2.31B | 2.44B | 2.43B | 1.67B | 2.48B | 2.50B | 1.81B | 1.45B | 1.23B |
| Gross Profit Ratio | 16.75% | 19.95% | 22.53% | 16.46% | 16.97% | 20.52% | 23.06% | 22.29% | 22.02% | 20.31% | 20.39% | 20.02% | 20.27% | 22.22% | 19.53% | 21.34% | 23.88% | 25.63% | 23.27% | 21.25% |
| Research & Development | 213.90M | 191.20M | 173.90M | 153.30M | 174.40M | 170.50M | 152.10M | 140.30M | 131.80M | 126.70M | 128.40M | 125.60M | 0.00 | 0.00 | 0.00 | 0.00 | 0.00 | 0.00 | 0.00 | 0.00 |
| General & Administrative | 841.00M | 781.80M | 706.90M | 649.10M | 674.00M | 695.50M | 662.20M | 622.30M | 610.60M | 603.09M | 589.03M | 566.41M | 594.60M | 554.81M | 509.13M | 527.17M | 468.22M | -113.77M | -116.51M | -133.60M |
| Selling & Marketing | 1.34B | 1.34B | 1.17B | 1.03B | 1.17B | 1.21B | 1.15B | 1.08B | 1.03B | 975.43M | 976.53M | 963.01M | 985.42M | 959.17M | 853.20M | 999.76M | 866.10M | 467.64M | 414.07M | 417.36M |
| SG&A | 2.22B | 2.12B | 1.88B | 1.67B | 1.85B | 1.91B | 1.81B | 1.70B | 1.64B | 1.58B | 1.57B | 1.53B | 1.58B | 1.51B | 1.36B | 1.53B | 1.33B | 353.87M | 297.56M | 283.77M |
| Other Expenses | 0.00 | 52.70M | 72.00M | 71.40M | 414.20M | 110.40M | -32.50M | 9.90M | 73.40M | -92.50M | -78.80M | -66.00M | 159.98M | -64.80M | -44.45M | -61.57M | 16.43M | -57.12M | -44.13M | -39.84M |
| Operating Expenses | 2.43B | 2.12B | 1.95B | 1.75B | 2.26B | 2.02B | 1.78B | 1.71B | 1.71B | 1.49B | 1.49B | 1.46B | 1.74B | 1.45B | 1.32B | 1.47B | 1.35B | 800.15M | 734.88M | 679.22M |
| Cost & Expenses | 16.32B | 16.71B | 13.51B | 11.16B | 12.82B | 12.79B | 11.70B | 10.49B | 10.34B | 10.40B | 10.43B | 10.68B | 11.35B | 9.97B | 8.20B | 10.61B | 9.33B | 6.04B | 5.52B | 5.23B |
| Interest Income | 64.90M | 31.90M | 17.70M | 11.40M | 24.20M | 19.70M | 16.10M | 20.30M | 19.50M | 16.20M | 19.00M | 41.40M | 61.60M | 54.11M | 93.90M | 73.47M | 61.20M | 45.10M | 28.70M | 27.40M |
| Interest Expense | 281.10M | 181.50M | 107.30M | 125.50M | 166.20M | 166.70M | 177.40M | 170.60M | 157.70M | 181.80M | 180.20M | 271.50M | 293.90M | 288.07M | 282.90M | 385.39M | 262.91M | 115.40M | 110.70M | 93.90M |
| Depreciation & Amortization | 1.07B | 742.20M | 756.80M | 766.10M | 868.90M | 785.10M | 748.30M | 712.20M | 655.20M | 636.60M | 595.00M | 593.50M | 593.70M | 619.00M | 640.00M | 726.80M | 709.40M | 367.10M | 358.50M | 368.20M |
| EBITDA | 1.74B | 2.61B | 2.09B | 1.15B | 1.16B | 1.52B | 1.99B | 1.59B | 1.61B | 1.56B | 1.41B | 1.51B | 1.39B | 1.69B | 1.11B | 1.81B | 1.95B | 1.46B | 1.14B | 959.63M |
| EBITDA Ratio | 10.41% | 13.43% | 14.00% | 10.24% | 9.12% | 11.48% | 15.28% | 14.13% | 14.48% | 13.69% | 12.84% | 13.08% | 5.84% | 15.41% | 12.94% | 15.83% | 18.62% | 20.53% | 18.05% | 16.44% |
| Operating Income | 360.80M | 1.70B | 1.46B | 340.50M | -89.00M | 779.40M | 1.18B | 823.30M | 888.80M | 886.33M | 792.34M | 853.63M | 704.19M | 984.85M | 351.97M | 1.02B | 1.15B | 1.01B | 724.07M | 552.50M |
| Operating Income Ratio | 2.16% | 9.31% | 9.78% | 3.02% | -0.70% | 5.75% | 9.15% | 7.29% | 8.03% | 7.92% | 7.06% | 7.41% | 5.84% | 8.99% | 4.12% | 8.74% | 11.00% | 14.36% | 11.62% | 9.56% |
| Total Other Income/Expenses | 22.60M | 186.50M | 87.20M | 200.60M | -345.40M | -133.70M | -137.50M | -123.40M | 105.70M | 175.40M | -147.60M | -188.44M | -199.82M | -203.88M | -168.63M | -288.74M | -173.00M | -35.02M | -49.82M | -54.97M |
| Income Before Tax | 383.40M | 1.49B | 1.38B | 10.80M | -230.30M | 645.70M | 1.04B | 699.90M | 751.30M | 740.95M | 656.01M | 654.66M | 504.37M | 780.97M | 183.34M | 728.45M | 979.58M | 977.21M | 674.25M | 497.53M |
| Income Before Tax Ratio | 2.30% | 8.18% | 9.26% | 0.10% | -1.81% | 4.76% | 8.08% | 6.20% | 6.79% | 6.62% | 5.84% | 5.68% | 4.18% | 7.13% | 2.14% | 6.27% | 9.35% | 13.86% | 10.82% | 8.61% |
| Income Tax Expense | 167.80M | 405.50M | 310.10M | -20.90M | -13.80M | 187.10M | 224.60M | 172.90M | 149.20M | 146.71M | 133.11M | 132.73M | 91.10M | 186.41M | -3.46M | 92.25M | 202.49M | 221.53M | 154.52M | 124.02M |
| Net Income | 100.80M | 1.06B | 1.30B | 42.10M | -208.80M | 408.50M | 775.20M | 496.80M | 585.30M | 549.10M | 446.44M | 444.87M | 333.51M | 512.75M | 186.80M | 529.84M | 718.23M | 757.40M | 519.46M | 323.09M |
| Net Income Ratio | 0.60% | 5.84% | 8.71% | 0.37% | -1.64% | 3.01% | 6.01% | 4.40% | 5.29% | 4.91% | 4.03% | 3.86% | 2.77% | 4.68% | 1.27% | 4.56% | 7.09% | 10.76% | 8.24% | 5.59% |
| EPS | 0.64 | 6.01 | 7.28 | 0.24 | -1.17 | 2.31 | 4.40 | 2.84 | 3.35 | 3.18 | 2.59 | 2.61 | 1.98 | 3.04 | 0.65 | 3.26 | 4.69 | 4.76 | 3.25 | 2.05 |
| EPS Diluted | 0.59 | 6.01 | 7.28 | 0.24 | -1.17 | 2.31 | 4.40 | 2.84 | 3.35 | 3.18 | 2.59 | 2.61 | 1.98 | 3.04 | 0.65 | 3.24 | 4.56 | 4.41 | 3.10 | 2.05 |
| Weighted Avg Shares Out | 158.17M | 177.28M | 178.52M | 178.52M | 178.52M | 176.69M | 176.32M | 175.04M | 174.92M | 172.42M | 172.41M | 170.59M | 168.71M | 168.54M | 167.49M | 162.59M | 158.47M | 157.21M | 158.09M | 158.03M |
| Weighted Avg Shares Out (Dil) | 171.51M | 177.28M | 178.52M | 178.52M | 178.52M | 176.69M | 176.32M | 175.04M | 174.92M | 172.42M | 172.41M | 170.59M | 168.71M | 168.54M | 167.49M | 163.74M | 163.65M | 171.01M | 167.33M | 158.03M |

Voestalpine AG (VLPNF) Q2 2024 Earnings Call Transcript

All You Need to Know About Voestalpine (VLPNY) Rating Upgrade to Buy

Voestalpine Trades At 4.5x EBITDA Despite Anticipated 25% EBITDA Drop

Voestalpine AG (VLPNF) Q4 2022 Earnings Call Transcript

Voestalpine AG (VLPNF) Q2 2022 Earnings Call Transcript

Voestalpine in advanced talks to sell majority stake in Texas plant

Should Value Investors Buy Voestalpine AG (VLPNY) Stock?

Is Voestalpine (VLPNY) Outperforming Other Basic Materials Stocks This Year?

Is Voestalpine (VLPNY) Outperforming Other Basic Materials Stocks This Year?

Is This the Time to Buy Growth or Value?
Source: https://incomestatements.info
Category: Stock Reports
