See more : Gamelancer Media Corp. (GMNG.CN) Income Statement Analysis – Financial Results
Complete financial analysis of Weatherford International plc (WFRD) income statement, including revenue, profit margins, EPS and key performance metrics. Get detailed insights into the financial performance of Weatherford International plc, a leading company in the Oil & Gas Equipment & Services industry within the Energy sector.
- PT Champ Resto Indonesia Tbk (ENAK.JK) Income Statement Analysis – Financial Results
- Axios Mobile Assets Corp. (AXBSF) Income Statement Analysis – Financial Results
- Trainers’ House Oyj (TRH1V.HE) Income Statement Analysis – Financial Results
- Evli Oyj (EVLI.HE) Income Statement Analysis – Financial Results
- Chubb Arabia Cooperative Insurance Company (8240.SR) Income Statement Analysis – Financial Results
Weatherford International plc (WFRD)
About Weatherford International plc
Weatherford International plc, an energy services company, provides equipment and services for the drilling, evaluation, completion, production, and intervention of oil, geothermal, and natural gas wells worldwide. The company operates in two segments, Western Hemisphere and Eastern Hemisphere. It offers artificial lift systems, including reciprocating rod, progressing cavity pumping, gas, hydraulic, plunger, and hybrid lift systems, as well as related automation and control systems; pressure pumping and reservoir stimulation services, such as acidizing, fracturing, cementing, and coiled-tubing intervention; and drill stem test tools, surface well testing, and multiphase flow measurement services. The company also provides safety, downhole reservoir monitoring, flow control, and multistage fracturing systems, as well as sand-control technologies, and production and isolation packers; liner hangers to suspend a casing string in high-temperature and high-pressure wells; cementing products, including plugs, float and stage equipment, and torque-and-drag reduction technology for zonal isolation; and pre-job planning and installation services. In addition, it offers directional drilling services, and logging and measurement services while drilling; services related to rotary-steerable systems, high-temperature and high-pressure sensors, drilling reamers, and circulation subs; rotating control devices and advanced automated control systems, as well as closed-loop drilling, air drilling, managed-pressure drilling, and underbalanced drilling services; open hole and cased-hole logging services; and intervention and remediation services. Further, the company provides tubular handling, management, and connection services; and re-entry, fishing, wellbore cleaning, and well abandonment services, as well as patented bottom hole, tubularhandling equipment, pressure-control equipment, and drill pipe and collars. The company was incorporated in 1972 and is based in Houston, Texas.
| Metric | 2023 | 2022 | 2021 | 2020 | 2019 | 2018 | 2017 | 2016 | 2015 | 2014 | 2013 | 2012 | 2011 | 2010 | 2009 | 2008 | 2007 | 2006 | 2005 | 2004 | 2003 | 2002 | 2001 | 2000 | 1999 | 1998 | 1997 | 1996 | 1995 | 1994 | 1993 | 1992 | 1991 | 1990 | 1989 | 1988 | 1987 | 1986 | 1985 |
|---|---|---|---|---|---|---|---|---|---|---|---|---|---|---|---|---|---|---|---|---|---|---|---|---|---|---|---|---|---|---|---|---|---|---|---|---|---|---|---|
| Revenue | 5.14B | 4.33B | 3.65B | 3.69B | 4.95B | 5.74B | 5.70B | 5.75B | 9.43B | 14.91B | 15.26B | 15.22B | 12.99B | 10.21B | 8.83B | 9.60B | 7.83B | 6.58B | 4.33B | 3.13B | 2.59B | 2.33B | 2.33B | 1.81B | 1.24B | 2.01B | 892.30M | 478.00M | 351.60M | 248.50M | 246.00M | 192.30M | 178.00M | 153.10M | 107.90M | 54.20M | 15.30M | 2.50M | 12.60M |
| Cost of Revenue | 3.40B | 3.02B | 2.72B | 2.81B | 3.85B | 4.51B | 4.89B | 5.19B | 8.02B | 11.46B | 12.30B | 11.86B | 1.91B | 8.85B | 6.46B | 6.24B | 5.06B | 4.22B | 2.95B | 2.16B | 1.83B | 1.58B | 1.53B | 1.05B | 727.20M | 1.26B | 606.10M | 356.70M | 241.50M | 166.80M | 169.40M | 140.20M | 125.10M | 107.20M | 72.90M | 34.20M | 10.00M | 800.00K | 1.90M |
| Gross Profit | 1.74B | 1.31B | 929.00M | 878.00M | 1.10B | 1.23B | 810.00M | 560.00M | 1.41B | 3.45B | 2.96B | 3.36B | 11.08B | 1.37B | 2.36B | 3.36B | 2.77B | 2.36B | 1.38B | 973.02M | 760.78M | 746.79M | 800.00M | 759.95M | 513.00M | 754.60M | 286.20M | 121.30M | 110.10M | 81.70M | 76.60M | 52.10M | 52.90M | 45.90M | 35.00M | 20.00M | 5.30M | 1.70M | 10.70M |
| Gross Profit Ratio | 33.89% | 30.27% | 25.49% | 23.83% | 22.22% | 21.41% | 14.21% | 9.74% | 14.97% | 23.14% | 19.40% | 22.08% | 85.26% | 13.37% | 26.78% | 34.98% | 35.42% | 35.89% | 31.91% | 31.07% | 29.36% | 32.07% | 34.35% | 41.89% | 41.36% | 37.53% | 32.07% | 25.38% | 31.31% | 32.88% | 31.14% | 27.09% | 29.72% | 29.98% | 32.44% | 36.90% | 34.64% | 68.00% | 84.92% |
| Research & Development | 112.00M | 90.00M | 85.00M | 97.00M | 136.00M | 139.00M | 158.00M | 159.00M | 231.00M | 290.00M | 265.00M | 257.00M | 244.70M | 214.48M | 194.65M | 192.66M | 169.32M | 149.43M | 107.36M | 83.55M | 82.93M | 79.59M | 0.00 | 0.00 | 0.00 | 0.00 | 0.00 | 0.00 | 0.00 | 0.00 | 0.00 | 0.00 | 0.00 | 0.00 | 0.00 | 0.00 | 0.00 | 0.00 | 0.00 |
| General & Administrative | 0.00 | 0.00 | -62.00M | 0.00 | 130.00M | 130.00M | 130.00M | 139.00M | 194.00M | 178.00M | 2.04B | 196.00M | 0.00 | 175.17M | 223.17M | 187.08M | 0.00 | 0.00 | 0.00 | 0.00 | 0.00 | 0.00 | 0.00 | 0.00 | 0.00 | 0.00 | 0.00 | 0.00 | 0.00 | 0.00 | 0.00 | 0.00 | 0.00 | 0.00 | 0.00 | 0.00 | 0.00 | 0.00 | 0.00 |
| Selling & Marketing | 0.00 | 0.00 | 0.00 | 0.00 | 765.00M | 764.00M | 910.00M | 970.00M | 1.35B | 1.73B | 1.73B | 1.59B | 0.00 | 0.00 | 1.24B | 1.08B | 0.00 | 0.00 | 0.00 | 0.00 | 0.00 | 0.00 | 0.00 | 0.00 | 0.00 | 0.00 | 0.00 | 0.00 | 0.00 | 0.00 | 0.00 | 0.00 | 0.00 | 0.00 | 0.00 | 0.00 | 0.00 | 0.00 | 0.00 |
| SG&A | 804.00M | 778.00M | -62.00M | 837.00M | 895.00M | 130.00M | 130.00M | 139.00M | 194.00M | 178.00M | 2.04B | 196.00M | 197.68M | 175.17M | 1.47B | 1.27B | 980.80M | 877.31M | 632.16M | 496.13M | 411.14M | 393.63M | 412.06M | 380.07M | 282.10M | 293.40M | 110.50M | 58.20M | 56.90M | 47.90M | 45.70M | 37.30M | 35.00M | 32.10M | 26.00M | 17.80M | 4.90M | 1.30M | 1.50M |
| Other Expenses | 4.00M | 9.00M | -351.00M | -53.00M | -116.00M | -46.00M | -34.00M | -24.00M | 3.00M | -17.00M | -77.00M | -100.00M | 0.00 | 0.00 | 0.00 | -81.34M | 0.00 | -5.83M | 73.66M | -22.41M | -14.95M | 208.19M | -21.53M | 206.63M | 166.70M | 170.70M | 33.70M | 16.80M | 20.80M | 14.30M | 12.30M | 10.50M | 8.00M | 5.70M | 4.00M | 1.60M | 400.00K | 1.70M | 18.50M |
| Operating Expenses | 920.00M | 877.00M | -328.00M | 934.00M | 1.03B | 368.00M | 2.13B | 2.25B | 1.54B | 1.92B | 2.31B | -1.19B | 582.78M | 581.09M | 1.66B | 1.38B | 1.15B | 1.02B | 813.18M | 557.28M | 479.12M | 681.40M | 390.53M | 586.70M | 448.80M | 464.10M | 144.20M | 75.00M | 77.70M | 62.20M | 58.00M | 47.80M | 43.00M | 37.80M | 30.00M | 19.40M | 5.30M | 3.00M | 20.00M |
| Cost & Expenses | 4.32B | 3.90B | -328.00M | 3.74B | 4.88B | 368.00M | 2.13B | 2.25B | 1.54B | 1.92B | 14.61B | -1.19B | 2.50B | 9.43B | 8.12B | 7.62B | 6.21B | 5.24B | 3.76B | 2.72B | 2.31B | 2.26B | 1.92B | 1.64B | 1.18B | 1.72B | 750.30M | 431.70M | 319.20M | 229.00M | 227.40M | 188.00M | 168.10M | 145.00M | 102.90M | 53.60M | 15.30M | 3.80M | 21.90M |
| Interest Income | 59.00M | 31.00M | 260.00M | 251.00M | 374.00M | 0.00 | 0.00 | 0.00 | 0.00 | 0.00 | 0.00 | 0.00 | 0.00 | 0.00 | 0.00 | 0.00 | 11.85M | 6.66M | 11.21M | 3.85M | 1.91M | 2.64M | 2.62M | 11.27M | 0.00 | 0.00 | 0.00 | 0.00 | 0.00 | 0.00 | 0.00 | 0.00 | 0.00 | 0.00 | 0.00 | 0.00 | 0.00 | 0.00 | 0.00 |
| Interest Expense | 182.00M | 179.00M | 260.00M | 266.00M | 362.00M | 614.00M | 579.00M | 499.00M | 468.00M | 515.00M | 516.00M | 486.00M | 453.29M | 405.79M | 366.75M | 243.68M | 183.13M | 109.58M | 80.34M | 63.56M | 76.73M | 85.52M | 74.01M | 59.26M | 0.00 | 54.50M | 0.00 | 16.50M | 16.70M | 13.70M | 7.60M | 5.40M | 3.30M | 3.10M | 2.10M | 800.00K | 0.00 | 0.00 | 0.00 |
| Depreciation & Amortization | 327.00M | 349.00M | 440.00M | 503.00M | 481.00M | 556.00M | 801.00M | 956.00M | 1.20B | 1.37B | 1.40B | 1.28B | 1.14B | 1.05B | 906.70M | 731.81M | 606.23M | 483.06M | 345.77M | 272.71M | 249.01M | 230.77M | 223.52M | 206.63M | 166.70M | 170.70M | 33.70M | 16.80M | 20.80M | 14.30M | 12.30M | 10.50M | 8.00M | 5.70M | 4.00M | 1.60M | 400.00K | 1.70M | 17.60M |
| EBITDA | 956.00M | 761.00M | 357.00M | -1.05B | 4.66B | -1.59B | -1.28B | -1.42B | -428.00M | 2.51B | 2.05B | 1.48B | 2.34B | 1.71B | 1.64B | 2.69B | 2.23B | 1.84B | 882.88M | 674.98M | 534.97M | 296.16M | 632.99M | 379.88M | 230.90M | 310.70M | 332.80M | 288.90M | 30.40M | 33.80M | 30.90M | 14.80M | 17.90M | 13.80M | 9.00M | 2.20M | -1.00M | 400.00K | 8.30M |
| EBITDA Ratio | 18.62% | 15.38% | 9.79% | -28.36% | 8.09% | -2.11% | -37.95% | -40.93% | -16.29% | 1.05% | 12.95% | 7.17% | 81.60% | 7.68% | 18.25% | 28.23% | 28.59% | 27.91% | 20.37% | 19.60% | 20.95% | 13.05% | 27.16% | 23.91% | 18.14% | 29.73% | 18.59% | 12.85% | 14.93% | 13.32% | 11.83% | 7.12% | 8.93% | -24.82% | 5.93% | 1.11% | -6.54% | -72.00% | 54.76% |
| Operating Income | 820.00M | 317.00M | -83.00M | -1.55B | -46.00M | -2.08B | -2.13B | -2.25B | -1.55B | 505.00M | 523.00M | 298.00M | 1.32B | 781.45M | 703.86M | 1.98B | 1.62B | 1.34B | 569.43M | 415.75M | 281.65M | 65.39M | 409.47M | 173.24M | 64.20M | 290.50M | 142.00M | 46.30M | 32.40M | 19.50M | 18.60M | 4.30M | 9.90M | 8.10M | 5.00M | 600.00K | -1.40M | -1.30M | -9.30M |
| Operating Income Ratio | 15.97% | 7.32% | -2.28% | -42.01% | -0.93% | -36.28% | -37.36% | -39.15% | -16.39% | 3.39% | 3.43% | 1.96% | 10.19% | 7.65% | 7.97% | 20.61% | 20.74% | 20.37% | 13.14% | 13.28% | 10.87% | 2.81% | 17.58% | 9.55% | 5.18% | 14.45% | 15.91% | 9.69% | 9.22% | 7.85% | 7.56% | 2.24% | 5.56% | 5.29% | 4.63% | 1.11% | -9.15% | -52.00% | -73.81% |
| Total Other Income/Expenses | -314.00M | -274.00M | -260.00M | -328.00M | 3.87B | -673.00M | -486.00M | -632.00M | -550.00M | -760.00M | -693.00M | -586.00M | -560.00M | -577.00M | -404.38M | -288.64M | -179.85M | -115.78M | 61.52M | 37.41M | -86.70M | -75.77M | -71.78M | -102.69M | -39.50M | -177.30M | 56.00M | -34.40M | -15.60M | -13.10M | -5.80M | 1.10M | -1.20M | 43.90M | 100.00K | 800.00K | 2.40M | 2.20M | 1.60M |
| Income Before Tax | 506.00M | 138.00M | -343.00M | -1.81B | 3.82B | -2.76B | -2.66B | -2.88B | -2.10B | -255.00M | -170.00M | -288.00M | 764.00M | 211.39M | 299.47M | 1.69B | 1.44B | 1.22B | 624.94M | 430.75M | 194.62M | -10.39M | 337.70M | 70.56M | 24.70M | 99.40M | 128.70M | 31.50M | 16.40M | 6.40M | 12.80M | 5.40M | 8.70M | 52.00M | 5.10M | 1.40M | 1.00M | 900.00K | -7.70M |
| Income Before Tax Ratio | 9.85% | 3.19% | -9.41% | -49.23% | 77.09% | -48.00% | -46.60% | -50.04% | -22.22% | -1.71% | -1.11% | -1.89% | 5.88% | 2.07% | 3.39% | 17.60% | 18.44% | 18.61% | 14.42% | 13.75% | 7.51% | -0.45% | 14.50% | 3.89% | 1.99% | 4.94% | 14.42% | 6.59% | 4.66% | 2.58% | 5.20% | 2.81% | 4.89% | 33.96% | 4.73% | 2.58% | 6.54% | 36.00% | -61.11% |
| Income Tax Expense | 57.00M | 87.00M | 86.00M | 85.00M | 135.00M | 34.00M | 137.00M | 496.00M | -145.00M | 284.00M | 144.00M | 462.00M | 486.00M | 172.08M | 19.55M | 288.81M | 332.76M | 316.52M | 159.17M | 92.67M | 50.60M | -4.36M | 123.05M | 109.45M | 8.50M | 34.60M | 45.00M | 7.00M | 5.10M | 1.80M | 4.90M | 4.20M | 2.80M | 20.40M | 2.20M | 500.00K | 300.00K | 400.00K | -3.60M |
| Net Income | 417.00M | 51.00M | -429.00M | -1.90B | 3.66B | -2.81B | -2.81B | -3.39B | -1.99B | -584.00M | -345.00M | -778.00M | 771.74M | 24.51M | 253.77M | 1.35B | 1.07B | 896.37M | 467.42M | 330.15M | 143.35M | -6.03M | 214.65M | -42.35M | -20.90M | 64.80M | 74.70M | 98.20M | 11.30M | 800.00K | 5.80M | 100.00K | 5.90M | 31.60M | 2.90M | 900.00K | 700.00K | 500.00K | -4.10M |
| Net Income Ratio | 8.12% | 1.18% | -11.77% | -51.53% | 73.90% | -48.94% | -49.36% | -59.00% | -21.04% | -3.92% | -2.26% | -5.11% | 5.94% | 0.24% | 2.87% | 14.10% | 13.67% | 13.62% | 10.79% | 10.54% | 5.53% | -0.26% | 9.22% | -2.33% | -1.69% | 3.22% | 8.37% | 20.54% | 3.21% | 0.32% | 2.36% | 0.05% | 3.31% | 20.64% | 2.69% | 1.66% | 4.58% | 20.00% | -32.54% |
| EPS | 5.79 | 0.72 | -6.13 | -27.13 | 51.93 | -2.82 | -2.84 | -3.82 | -2.55 | -0.75 | -0.45 | -1.02 | 1.03 | 0.03 | 0.12 | 2.04 | 3.16 | 2.59 | 1.56 | 1.23 | 1.13 | -0.05 | 0.47 | -0.10 | -0.05 | 0.17 | 0.49 | 0.46 | 0.10 | 0.02 | -0.02 | 0.00 | 0.07 | 0.39 | 0.04 | 0.01 | 0.01 | 0.01 | -0.05 |
| EPS Diluted | 5.64 | 0.71 | -6.13 | -27.13 | 51.93 | -2.82 | -2.84 | -3.82 | -2.55 | -0.75 | -0.45 | -1.02 | 1.02 | 0.03 | 0.12 | 1.99 | 3.08 | 2.53 | 1.47 | 1.15 | 1.09 | -0.05 | 0.44 | -0.10 | -0.05 | 0.17 | 0.48 | 0.46 | 0.10 | 0.02 | -0.02 | 0.00 | 0.07 | 0.39 | 0.04 | 0.01 | 0.01 | 0.01 | -0.05 |
| Weighted Avg Shares Out | 72.00M | 71.00M | 70.00M | 70.00M | 70.00M | 997.00M | 990.00M | 887.00M | 779.00M | 777.00M | 772.00M | 765.00M | 752.53M | 743.13M | 715.00M | 682.70M | 338.52M | 346.12M | 300.34M | 268.00M | 126.52M | 120.06M | 456.07M | 437.83M | 398.10M | 386.87M | 183.74M | 156.73M | 118.95M | 50.52M | 94.12M | 80.00M | 90.77M | 81.03M | 72.50M | 72.00M | 70.00M | 66.67M | 86.32M |
| Weighted Avg Shares Out (Dil) | 74.00M | 72.00M | 70.00M | 70.00M | 70.00M | 997.00M | 990.00M | 887.00M | 779.00M | 777.00M | 772.00M | 765.00M | 759.57M | 750.13M | 723.00M | 698.18M | 347.76M | 354.83M | 322.29M | 297.37M | 131.76M | 120.06M | 533.02M | 437.83M | 418.00M | 386.87M | 186.78M | 163.40M | 118.95M | 50.52M | 94.12M | 80.00M | 90.77M | 81.03M | 72.50M | 72.00M | 70.00M | 66.67M | 86.32M |

Here's Why Momentum in Weatherford (WFRD) Should Keep going

Oil Prices May Have Found a Floor: 3 Top-Ranked Oil and Gas Stocks for the Next Rally

4 Stocks Powered by Increasing Cash Flow for Your Portfolio

Yacktman Asset Management Enters South Korea ETF Position

Wall Street Analysts See a 28.79% Upside in Weatherford (WFRD): Can the Stock Really Move This High?
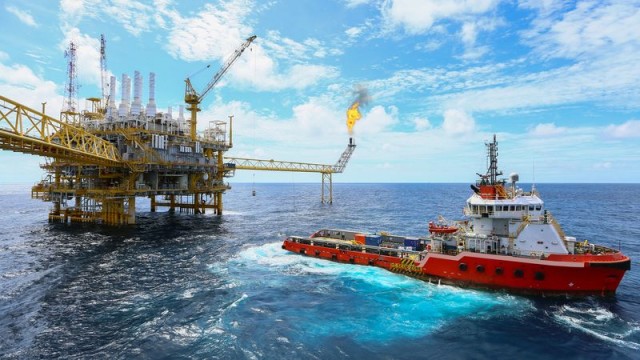
Here's how to play oil-industry stocks for long-term growth of 20% or more

Is Weatherford International (WFRD) Stock Outpacing Its Oils-Energy Peers This Year?

New Strong Buy Stocks for May 1st
Weatherford (WFRD) Surpasses Q1 Earnings and Revenue Estimates

Weatherford (WFRD) to Report Q1 Earnings: What to Expect?
Source: https://incomestatements.info
Category: Stock Reports
