See more : Can Fin Homes Limited (CANFINHOME.NS) Income Statement Analysis – Financial Results
Complete financial analysis of Wizz Air Holdings Plc (WZZZY) income statement, including revenue, profit margins, EPS and key performance metrics. Get detailed insights into the financial performance of Wizz Air Holdings Plc, a leading company in the Airlines, Airports & Air Services industry within the Industrials sector.
- Morris Home Holdings Limited (1575.HK) Income Statement Analysis – Financial Results
- Ladam Affordable Housing Limited (LAHL.BO) Income Statement Analysis – Financial Results
- Inter Action Corporation (IACYF) Income Statement Analysis – Financial Results
- MGI – Media and Games Invest SE (MDGIF) Income Statement Analysis – Financial Results
- American Pacific Mining Corp. (USGD.CN) Income Statement Analysis – Financial Results
Wizz Air Holdings Plc (WZZZY)
About Wizz Air Holdings Plc
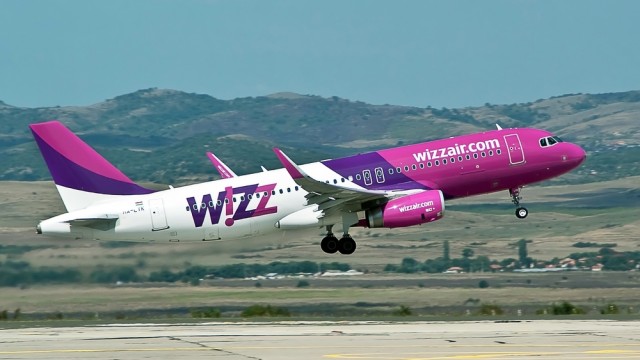
Wizz Air Holdings Plc, together with its subsidiaries, provides passenger air transportation services on scheduled short-haul and medium-haul point-to-point routes in Europe and the Middle East. As of June 08, 2022, it operated a fleet of 154 aircraft that offered services for approximately 1000 routes from 194 airports in 51 countries. The company provides its services under the Wizz Air brand. Wizz Air Holdings Plc was founded in 2003 and is based in Saint Helier, Jersey.
| Metric | 2024 | 2023 | 2022 | 2021 | 2020 | 2019 | 2018 | 2017 | 2016 | 2015 | 2014 | 2013 | 2012 |
|---|---|---|---|---|---|---|---|---|---|---|---|---|---|
| Revenue | 5.07B | 3.90B | 1.66B | 739.00M | 2.76B | 2.32B | 1.95B | 1.57B | 1.43B | 1.23B | 1.01B | 851.31M | 766.12M |
| Cost of Revenue | 3.86B | 4.21B | 2.03B | 1.25B | 2.31B | 1.95B | 1.56B | 1.24B | 1.13B | 1.01B | 856.95M | 766.95M | 682.60M |
| Gross Profit | 1.21B | -314.90M | -368.60M | -507.20M | 453.60M | 368.50M | 389.10M | 326.90M | 300.60M | 216.60M | 154.87M | 84.36M | 83.52M |
| Gross Profit Ratio | 23.94% | -8.08% | -22.16% | -68.63% | 16.43% | 15.89% | 19.97% | 20.81% | 21.03% | 17.65% | 15.31% | 9.91% | 10.90% |
| Research & Development | 0.00 | 0.00 | 0.00 | 0.00 | 0.00 | 0.00 | 0.00 | 0.00 | 0.00 | 0.00 | 0.00 | 0.00 | 0.00 |
| General & Administrative | 4.10M | 1.70M | 1.40M | 0.00 | 0.00 | 0.00 | 0.00 | 0.00 | 0.00 | 0.00 | 0.00 | 0.00 | 0.00 |
| Selling & Marketing | 117.10M | 91.50M | 43.40M | 19.60M | 44.10M | 37.80M | 34.00M | 27.90M | 23.50M | 18.80M | 10.86M | 15.26M | 13.14M |
| SG&A | 121.20M | 93.20M | 43.40M | 19.60M | 44.10M | 37.80M | 34.00M | 27.90M | 23.50M | 18.80M | 10.86M | 15.26M | 13.14M |
| Other Expenses | 655.40M | 33.83M | 4.64M | 0.00 | 0.00 | 0.00 | 0.00 | 0.00 | 0.00 | 0.00 | 0.00 | 0.00 | 0.00 |
| Operating Expenses | 776.60M | 251.90M | 96.60M | 20.80M | 115.30M | 68.70M | 97.20M | 80.30M | 65.20M | 49.30M | 45.08M | 46.37M | 39.32M |
| Cost & Expenses | 4.64B | 4.46B | 2.13B | 1.27B | 2.42B | 2.02B | 1.66B | 1.32B | 1.19B | 1.06B | 902.03M | 813.32M | 721.92M |
| Interest Income | 80.50M | 20.80M | 2.80M | 9.00M | 45.40M | 6.20M | 2.80M | 300.00K | 1.00M | 1.00M | 381.00K | 805.00K | 2.13M |
| Interest Expense | 196.70M | 135.20M | 89.50M | 78.40M | 91.50M | 4.10M | 5.00M | 4.00M | 2.70M | 5.60M | 7.77M | 6.96M | 7.12M |
| Depreciation & Amortization | 755.30M | 591.14M | 450.40M | 361.71M | 377.07M | 342.35M | 91.13M | 56.70M | 26.62M | 33.90M | 25.39M | 19.13M | 17.17M |
| EBITDA | 1.29B | 171.70M | -105.70M | -143.20M | 767.10M | 558.40M | 381.80M | 298.30M | 248.20M | 231.20M | 128.60M | 59.79M | 66.21M |
| EBITDA Ratio | 25.49% | 1.84% | -6.35% | -19.73% | 27.71% | 17.18% | 19.60% | 18.99% | 17.37% | 17.80% | 12.70% | 7.02% | 8.64% |
| Operating Income | 437.90M | -466.80M | -465.30M | -528.10M | 338.30M | 299.80M | 291.80M | 246.70M | 235.50M | 167.30M | 109.78M | 37.99M | 44.20M |
| Operating Income Ratio | 8.63% | -11.98% | -27.97% | -71.46% | 12.25% | 12.93% | 14.98% | 15.70% | 16.48% | 13.63% | 10.85% | 4.46% | 5.77% |
| Total Other Income/Expenses | -96.80M | -97.80M | -176.20M | -38.40M | -44.20M | -57.70M | -5.70M | 9.10M | -34.10M | 24.40M | -14.40M | -4.29M | -2.29M |
| Income Before Tax | 341.10M | -564.60M | -641.50M | -566.50M | 294.10M | 300.20M | 286.10M | 255.80M | 201.40M | 191.70M | 95.36M | 33.70M | 41.92M |
| Income Before Tax Ratio | 6.72% | -14.49% | -38.56% | -76.66% | 10.65% | 12.94% | 14.69% | 16.28% | 14.09% | 15.62% | 9.42% | 3.96% | 5.47% |
| Income Tax Expense | -24.80M | -29.50M | 900.00K | 9.50M | 13.10M | 4.90M | 11.00M | 9.80M | 8.50M | 8.50M | 7.65M | 4.44M | 918.00K |
| Net Income | 376.60M | -523.00M | -631.80M | -572.10M | 281.10M | 291.60M | 275.10M | 246.00M | 192.90M | 183.20M | 87.70M | 29.26M | 41.00M |
| Net Income Ratio | 7.42% | -13.43% | -37.98% | -77.42% | 10.18% | 12.57% | 14.12% | 15.66% | 13.50% | 14.93% | 8.67% | 3.44% | 5.35% |
| EPS | 2.96 | -5.07 | -6.33 | -6.69 | 3.76 | 4.01 | 0.54 | 1.08 | 0.91 | 3.61 | 0.42 | 0.14 | 0.20 |
| EPS Diluted | 2.95 | -5.07 | -6.33 | -6.69 | 2.22 | 2.29 | 0.54 | 0.49 | 0.39 | 1.73 | 0.42 | 0.14 | 0.20 |
| Weighted Avg Shares Out | 127.10M | 103.21M | 99.81M | 85.55M | 74.69M | 72.75M | 507.41M | 229.02M | 213.38M | 50.77M | 209.05M | 209.05M | 209.05M |
| Weighted Avg Shares Out (Dil) | 127.71M | 103.21M | 99.81M | 85.55M | 127.26M | 127.13M | 507.41M | 507.08M | 506.21M | 106.54M | 209.05M | 209.05M | 209.05M |

Wizz Air Holdings Plc (WZZAF) Q4 2024 Earnings Call Transcript

Wizz Air returns to post-pandemic profitability, sees record passenger count

Wizz Air returns to post-pandemic profitability, sees record passenger count

Wizz Air bound by engine recalls despite expected return to profit
Source: https://incomestatements.info
Category: Stock Reports
