See more : Okayamaken Freight Transportation Co., Ltd. (9063.T) Income Statement Analysis – Financial Results
Complete financial analysis of Extraction Oil & Gas, Inc. (XOG) income statement, including revenue, profit margins, EPS and key performance metrics. Get detailed insights into the financial performance of Extraction Oil & Gas, Inc., a leading company in the Oil & Gas Exploration & Production industry within the Energy sector.
- Spin Master Corp. (TOY.TO) Income Statement Analysis – Financial Results
- Nexxen International Ltd. (NEXN) Income Statement Analysis – Financial Results
- Nippon Sharyo, Ltd. (7102.T) Income Statement Analysis – Financial Results
- Ready Capital Corporation (RC-PE) Income Statement Analysis – Financial Results
- 374Water, Inc. (SCWO) Income Statement Analysis – Financial Results
Extraction Oil & Gas, Inc. (XOG)
| Metric | 2020 | 2019 | 2018 | 2017 | 2016 | 2015 | 2014 |
|---|---|---|---|---|---|---|---|
| Revenue | 557.90M | 906.64M | 1.06B | 604.30M | 278.09M | 197.75M | 92.84M |
| Cost of Revenue | 577.75M | 689.97M | 605.53M | 477.67M | 288.12M | 194.21M | 48.85M |
| Gross Profit | -19.84M | 216.66M | 455.21M | 126.62M | -10.03M | 3.54M | 43.99M |
| Gross Profit Ratio | -3.56% | 23.90% | 42.91% | 20.95% | -3.61% | 1.79% | 47.38% |
| Research & Development | 0.00 | 0.00 | 0.00 | 0.00 | 0.00 | 0.00 | 0.00 |
| General & Administrative | 56.48M | 98.85M | 134.60M | 110.17M | 232.39M | 37.15M | 19.60M |
| Selling & Marketing | 0.00 | 0.00 | 0.00 | 0.00 | 0.00 | 0.00 | 0.00 |
| SG&A | 56.48M | 98.85M | 134.60M | 110.17M | 232.39M | 37.15M | 19.60M |
| Other Expenses | 265.27M | 144.19M | 71.02M | 36.71M | 47.31M | 20.99M | 126.00K |
| Operating Expenses | 321.75M | 243.04M | 205.63M | 146.87M | 279.70M | 58.14M | 19.72M |
| Cost & Expenses | 899.49M | 933.01M | 811.16M | 624.55M | 567.82M | 252.35M | 68.58M |
| Interest Income | 0.00 | 0.00 | 0.00 | 0.00 | 0.00 | 0.00 | 0.00 |
| Interest Expense | 61.80M | 79.23M | 123.33M | 51.89M | 68.84M | 51.03M | 22.45M |
| Depreciation & Amortization | -870.30M | -1.39B | 55.16M | -35.97M | -126.71M | 58.36M | 48.03M |
| EBITDA | -1.21B | -1.42B | 304.75M | -56.22M | -416.44M | 3.77M | 72.30M |
| EBITDA Ratio | -217.22% | -156.33% | 28.73% | -9.30% | -149.75% | 1.90% | 77.87% |
| Operating Income | -341.59M | -26.38M | 249.58M | -20.25M | -289.73M | -54.60M | 24.26M |
| Operating Income Ratio | -61.23% | -2.91% | 23.53% | -3.35% | -104.19% | -27.61% | 26.14% |
| Total Other Income/Expenses | -925.94M | -1.45B | -60.88M | -87.86M | -195.55M | 7.33M | 25.58M |
| Income Before Tax | -1.27B | -1.48B | 188.71M | -108.11M | -485.28M | -47.26M | 49.84M |
| Income Before Tax Ratio | -227.20% | -162.87% | 17.79% | -17.89% | -174.51% | -23.90% | 53.69% |
| Income Tax Expense | 6.16M | -109.18M | 66.85M | -63.70M | -29.28M | 0.00 | 0.00 |
| Net Income | -1.27B | -1.39B | 114.57M | -44.41M | -456.00M | -47.26M | 49.84M |
| Net Income Ratio | -228.30% | -153.03% | 10.80% | -7.35% | -163.98% | -23.90% | 53.69% |
| EPS | -9.22 | -9.16 | 0.66 | -0.26 | -2.65 | -0.34 | 0.36 |
| EPS Diluted | -9.22 | -9.16 | 0.66 | -0.26 | -2.65 | -0.34 | 0.36 |
| Weighted Avg Shares Out | 138.15M | 151.48M | 174.75M | 171.83M | 171.83M | 138.15M | 138.15M |
| Weighted Avg Shares Out (Dil) | 138.15M | 151.48M | 174.75M | 171.83M | 171.83M | 138.15M | 138.15M |

New Strong Buy Stocks for October 21st
Top Ranked Momentum Stocks to Buy for September 20th

5 Energy Stocks Gurus Love as Oil Prices Rise
Extraction Oil & Gas' (XOG) Shares March Higher, Can It Continue?
Bonanza Makes Another Common Sense Move - More Scale, More Free Cash, More Yield

Extraction Announces First-Quarter 2021 Results
Can the Uptrend Continue for Extraction Oil & Gas (XOG)?

EXTRACTION OIL & GAS INVESTOR ALERT by the Former Attorney General of Louisiana: Kahn Swick & Foti, LLC Investigates Merger of Extraction Oil & Gas, Inc. - XOG
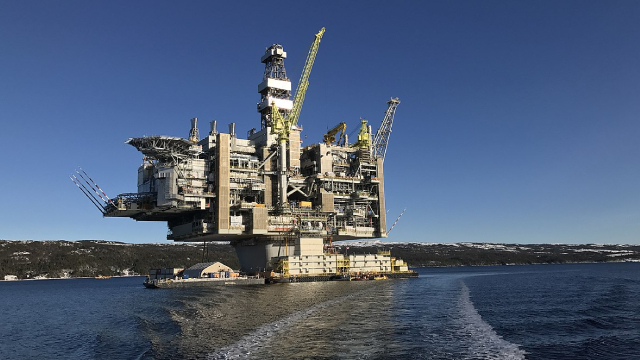
Bonanza to Merge With Extraction in $2.6B All-Stock Deal

Top 5 1st-Quarter Trades of Donald Smith & Co.
Source: https://incomestatements.info
Category: Stock Reports
