See more : Univance Corporation (7254.T) Income Statement Analysis – Financial Results
Complete financial analysis of Yellow Corporation (YELLQ) income statement, including revenue, profit margins, EPS and key performance metrics. Get detailed insights into the financial performance of Yellow Corporation, a leading company in the Trucking industry within the Industrials sector.
- KC Cottrell Co., Ltd. (119650.KS) Income Statement Analysis – Financial Results
- ABS-CBN Holdings Corporation (ABSOF) Income Statement Analysis – Financial Results
- Tekumo, Inc. (TKMO) Income Statement Analysis – Financial Results
- Concord Control Systems Limite (CNCRD.BO) Income Statement Analysis – Financial Results
- Dune Acquisition Corporation (DUNEW) Income Statement Analysis – Financial Results
Yellow Corporation (YELLQ)
About Yellow Corporation
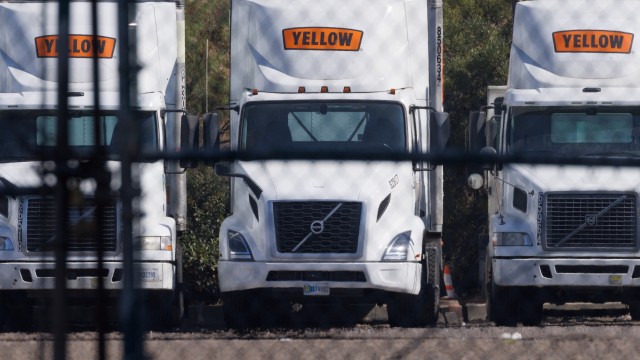
Yellow Corporation does not have significant operations. Previously, the company provided various transportation services primarily in North America. The company primarily offered less-than-truckload (LTL) shipments and supply chain solutions to ship industrial, commercial, and retail goods. It also provided customer-specific logistics solutions, including truckload, residential, and warehouse solutions, as well as apparels, appliances, automotive parts, chemicals, food, furniture, glass, machinery, metal, metal products, non-bulk petroleum products, rubber, textiles, wood, and other manufactured products or components. In addition, the company offered specialized services, such as guaranteed expedited, time-specific delivery, cross-border, exhibit, product return, and government material shipment services; and consolidation and distribution, reverse logistics, and residential white glove services. As of December 31, 2022, it had a fleet of approximately 12,700 tractors comprising 11,700 owned and 1,000 leased tractors; and approximately 42,000 trailers consisting of 34,800 owned and 7,200 leased trailers. The company was formerly known as YRC Worldwide Inc. and changed its name to Yellow Corporation in February 2021. Yellow Corporation was founded in 1924 and is based in Nashville, Tennessee. On August 6, 2023, Yellow Corporation, along with its affiliates, filed a voluntary petition for reorganization under Chapter 11 in the U.S. Bankruptcy Court for the District of Delaware.
| Metric | 2022 | 2021 | 2020 | 2019 | 2018 | 2017 | 2016 |
|---|---|---|---|---|---|---|---|
| Revenue | 5.24B | 5.12B | 4.51B | 4.87B | 5.09B | 4.89B | 4.70B |
| Cost of Revenue | 4.78B | 5.02B | 4.50B | 4.86B | 4.97B | 4.77B | 4.34B |
| Gross Profit | 467.90M | 104.30M | 11.20M | 10.70M | 122.10M | 118.40M | 361.90M |
| Gross Profit Ratio | 8.92% | 2.04% | 0.25% | 0.22% | 2.40% | 2.42% | 7.70% |
| Research & Development | 0.00 | 0.00 | 0.00 | 0.00 | 0.00 | 0.00 | 0.00 |
| General & Administrative | 10.50M | 59.30M | -6.30M | 3.10M | 0.00 | 0.00 | 0.00 |
| Selling & Marketing | 0.00 | 0.00 | 0.00 | 0.00 | 0.00 | 0.00 | 0.00 |
| SG&A | 10.50M | 59.30M | -6.30M | 3.10M | 0.00 | 0.00 | 252.20M |
| Other Expenses | 259.60M | 400.00K | 6.30M | 1.00M | 0.00 | 0.00 | 0.00 |
| Operating Expenses | 270.10M | 353.20M | 233.30M | 244.30M | 0.00 | 0.00 | 252.20M |
| Cost & Expenses | 5.05B | 5.02B | 4.50B | 4.86B | 4.97B | 4.77B | 4.59B |
| Interest Income | 0.00 | 0.00 | 0.00 | 0.00 | 0.00 | 0.00 | 0.00 |
| Interest Expense | 162.90M | 150.70M | 135.90M | 111.20M | 105.80M | 102.80M | 103.40M |
| Depreciation & Amortization | 239.10M | 143.60M | 134.90M | 152.40M | 147.70M | 147.70M | 159.80M |
| EBITDA | 332.80M | 188.30M | 197.70M | 155.30M | 284.80M | 232.40M | 287.80M |
| EBITDA Ratio | 6.35% | 4.84% | 3.24% | 3.35% | 5.30% | 5.44% | 5.74% |
| Operating Income | 197.80M | 104.30M | 11.20M | 10.70M | 122.10M | 118.40M | 109.70M |
| Operating Income Ratio | 3.77% | 2.04% | 0.25% | 0.22% | 2.40% | 2.42% | 2.34% |
| Total Other Income/Expenses | -171.30M | -209.60M | -129.60M | -119.00M | -111.60M | -136.50M | -85.10M |
| Income Before Tax | 26.50M | -106.00M | -73.10M | -108.30M | 31.30M | -18.10M | 24.60M |
| Income Before Tax Ratio | 0.51% | -2.07% | -1.62% | -2.22% | 0.61% | -0.37% | 0.52% |
| Income Tax Expense | 4.70M | 3.10M | -19.60M | -4.30M | 11.10M | -7.30M | 3.10M |
| Net Income | 21.80M | -109.10M | -53.50M | -104.00M | 20.20M | -10.80M | 21.50M |
| Net Income Ratio | 0.42% | -2.13% | -1.19% | -2.13% | 0.40% | -0.22% | 0.46% |
| EPS | 0.42 | -2.15 | -1.28 | -3.13 | 0.61 | -0.33 | 0.66 |
| EPS Diluted | 0.42 | -2.15 | -1.28 | -3.13 | 0.60 | -0.33 | 0.65 |
| Weighted Avg Shares Out | 51.35M | 50.72M | 41.69M | 33.25M | 32.98M | 32.69M | 32.42M |
| Weighted Avg Shares Out (Dil) | 52.23M | 50.72M | 41.69M | 33.25M | 33.86M | 32.69M | 33.04M |

Big Yellow: Back To Status Quo And To 'Buy' (Rating Upgrade)

Yellow Cake: A Bright Future Ahead

Yellow Rose by Kendra Scott Announces Capsule Yellowstone Collection

XPO: What The Yellow Corp. Bankruptcy Means For The Company

Bankrupt Trucking Company Yellow Auctions Off 75% of Properties

Bidder Aims to Save Bankrupt Trucking Firm Yellow

Old Dominion Freight Line: Profiting From Yellow Corp's Bankruptcy

Pressure grows on US Treasury to salvage trucking giant Yellow

XPO, Up 102% YTD, Rallies As Trucking Market Adjusts To Yellow Bankruptcy

Exclusive: Trucking firm prepares long-shot bid for Yellow, seeks US Treasury support
Source: https://incomestatements.info
Category: Stock Reports
