See more : Story-I Limited (SRY.AX) Income Statement Analysis – Financial Results
Complete financial analysis of Air China Limited (AIRYY) income statement, including revenue, profit margins, EPS and key performance metrics. Get detailed insights into the financial performance of Air China Limited, a leading company in the Airlines, Airports & Air Services industry within the Industrials sector.
- Nile Limited (NILE.BO) Income Statement Analysis – Financial Results
- LYW Cyber Technology Group Holding, Inc. (CDNO) Income Statement Analysis – Financial Results
- PT Arita Prima Indonesia Tbk (APII.JK) Income Statement Analysis – Financial Results
- Bengal Energy Ltd. (BNG.TO) Income Statement Analysis – Financial Results
- TuSimple Holdings Inc. (TSP) Income Statement Analysis – Financial Results
Air China Limited (AIRYY)
About Air China Limited
Air China Limited, together with its subsidiaries, provides air passenger, air cargo, and airline-related services in Mainland China, Hong Kong, Macau, Taiwan, Europe, North America, Japan, Korea, the Asia Pacific, and internationally. The company operates through Airline Operations and Other Operations segments. It provides aircraft engineering and airport ground handling services. The company is also involved in the import and export trading activities; and provision of cabin, airline catering, air ticketing, human resources, aircraft overhaul and maintenance, and financial services. As of December 31, 2021, it owned and operated 746 passenger aircraft, including business jets. The company was founded in 1988 and is based in Beijing, the People's Republic of China. Air China Limited is a subsidiary of China National Aviation Holding Corporation Limited.
| Metric | 2023 | 2022 | 2021 | 2020 | 2019 | 2018 | 2017 | 2016 | 2015 | 2014 | 2013 | 2012 | 2011 | 2010 | 2009 | 2008 | 2007 | 2006 | 2005 | 2004 | 2003 | 2002 |
|---|---|---|---|---|---|---|---|---|---|---|---|---|---|---|---|---|---|---|---|---|---|---|
| Revenue | 141.10B | 52.90B | 74.53B | 69.50B | 136.18B | 136.77B | 121.36B | 113.96B | 108.93B | 104.83B | 97.63B | 99.84B | 97.14B | 80.96B | 51.10B | 52.97B | 49.74B | 47.01B | 40.08B | 34.85B | 24.20B | 24.81B |
| Cost of Revenue | 134.01B | 82.81B | 85.84B | 75.63B | 113.25B | 115.13B | 100.30B | 87.20B | 83.69B | 87.84B | 82.65B | 80.77B | 76.69B | 61.00B | 41.95B | 48.61B | 40.31B | 38.97B | 32.01B | 26.02B | 19.18B | 18.39B |
| Gross Profit | 7.09B | -29.91B | -11.31B | -6.13B | 22.93B | 21.64B | 21.06B | 26.76B | 25.23B | 16.98B | 14.98B | 19.07B | 20.45B | 19.96B | 9.15B | 4.36B | 9.43B | 8.04B | 8.07B | 8.83B | 5.02B | 6.42B |
| Gross Profit Ratio | 5.02% | -56.55% | -15.18% | -8.82% | 16.84% | 15.82% | 17.36% | 23.48% | 23.17% | 16.20% | 15.35% | 19.10% | 21.05% | 24.65% | 17.90% | 8.24% | 18.96% | 17.10% | 20.13% | 25.34% | 20.76% | 25.87% |
| Research & Development | 373.48M | 243.58M | 152.57M | 179.39M | 491.36M | 107.06M | 94.50M | 14.43M | 23.56M | 28.15M | 18.18M | 0.00 | 0.00 | 0.00 | 0.00 | 0.00 | 0.00 | 0.00 | 0.00 | 0.00 | 0.00 | 0.00 |
| General & Administrative | 1.23B | 4.80B | 997.23M | 850.53M | 982.40M | 1.20B | 1.20B | 1.04B | 1.08B | 949.29M | 868.47M | 1.09B | 1.02B | 840.06M | 1.62B | 1.57B | 1.31B | 2.18B | 1.85B | 1.74B | 1.23B | 1.23B |
| Selling & Marketing | 3.53B | 3.53B | 4.45B | 4.37B | 6.64B | 6.35B | 6.11B | 5.59B | 6.15B | 7.43B | 7.20B | 6.89B | 6.52B | 5.50B | 3.81B | 3.28B | 3.29B | 2.62B | 2.23B | 1.81B | 1.45B | 1.56B |
| SG&A | 4.76B | 8.33B | 5.45B | 5.22B | 7.62B | 7.54B | 7.31B | 6.64B | 7.23B | 8.38B | 8.07B | 7.98B | 7.54B | 6.34B | 5.43B | 4.86B | 4.60B | 4.81B | 4.09B | 3.56B | 2.68B | 2.79B |
| Other Expenses | 5.28B | 205.01M | 16.42M | 25.38M | -73.69M | 131.41M | -145.48M | 1.12B | 878.82M | 1.23B | 829.52M | 1.37B | 1.08B | 2.55B | 3.92B | 233.53M | 255.40M | 433.31M | 319.75M | 192.67M | 442.29M | 456.65M |
| Operating Expenses | 10.41B | 5.83B | 5.53B | 4.81B | 8.20B | 8.26B | 8.31B | 9.92B | 10.45B | 10.84B | 10.58B | 11.80B | 12.07B | 9.45B | 6.94B | 5.94B | 5.81B | 5.92B | 5.06B | 4.42B | 2.95B | 3.39B |
| Cost & Expenses | 144.42B | 88.64B | 91.37B | 80.44B | 121.45B | 123.39B | 108.61B | 97.12B | 94.14B | 98.68B | 93.23B | 92.57B | 88.76B | 70.46B | 48.89B | 54.55B | 46.12B | 44.89B | 37.07B | 30.44B | 22.13B | 21.78B |
| Interest Income | 605.00M | 228.72M | 112.06M | 191.60M | 163.19M | 172.56M | 223.75M | 127.08M | 152.26M | 219.21M | 323.19M | 244.94M | 237.95M | 63.29M | 23.55M | 96.31M | 108.11M | 83.96M | 0.00 | 0.00 | 0.00 | 0.00 |
| Interest Expense | 6.94B | 6.47B | 5.50B | 5.10B | 4.95B | 2.91B | 3.06B | 3.24B | 2.81B | 2.94B | 2.69B | 2.26B | 1.44B | 1.17B | 1.17B | 1.77B | 1.92B | 1.92B | 840.05M | 1.81B | 2.48B | 2.84B |
| Depreciation & Amortization | 27.12B | 21.24B | 21.07B | 20.56B | 21.57B | 14.68B | 13.76B | 13.63B | 13.04B | 11.39B | 10.99B | 10.29B | 9.44B | 8.48B | 6.87B | 6.21B | 5.66B | 4.57B | 4.15B | 3.62B | 3.22B | 3.09B |
| EBITDA | 32.40B | -18.16B | 4.61B | 7.05B | 35.35B | 27.40B | 28.16B | 26.96B | 24.91B | 19.44B | 18.29B | 19.56B | 20.99B | 24.68B | 13.36B | -2.87B | 12.63B | 10.44B | 7.16B | 4.52B | 5.29B | 6.12B |
| EBITDA Ratio | 22.97% | -34.38% | 6.35% | 10.62% | 25.90% | 19.76% | 23.82% | 23.94% | 23.18% | 18.45% | 19.41% | 19.41% | 23.90% | 33.13% | 26.56% | 9.65% | 25.63% | 24.15% | 17.86% | 23.05% | 21.85% | 24.67% |
| Operating Income | -3.32B | -46.08B | -21.85B | -18.50B | 9.18B | 9.83B | 11.63B | 9.18B | 8.34B | 3.92B | 3.96B | 5.69B | 9.15B | 14.26B | 4.21B | -11.07B | 4.99B | 4.76B | 2.46B | 3.12B | 62.71M | 839.93M |
| Operating Income Ratio | -2.36% | -87.12% | -29.32% | -26.62% | 6.74% | 7.18% | 9.58% | 8.06% | 7.66% | 3.74% | 4.06% | 5.70% | 9.42% | 17.62% | 8.25% | -20.90% | 10.04% | 10.12% | 6.14% | 8.96% | 0.26% | 3.39% |
| Total Other Income/Expenses | 1.66B | -9.77B | -4.42B | -7.12B | -5.18B | -2.92B | -145.42M | -5.26B | -5.68B | 1.03B | 624.09M | 1.38B | 971.34M | 760.74M | 1.10B | 218.98M | 368.13M | 108.25M | 97.74M | 2.82B | 97.26M | 209.26M |
| Income Before Tax | -1.66B | -45.88B | -21.84B | -18.47B | 9.10B | 9.96B | 11.48B | 10.22B | 9.04B | 5.02B | 4.58B | 7.04B | 10.12B | 15.03B | 5.31B | -10.85B | 5.20B | 4.87B | 2.56B | 3.22B | 159.98M | 1.05B |
| Income Before Tax Ratio | -1.18% | -86.73% | -29.30% | -26.58% | 6.69% | 7.28% | 9.46% | 8.97% | 8.30% | 4.79% | 4.69% | 7.05% | 10.42% | 18.56% | 10.40% | -20.49% | 10.46% | 10.35% | 6.38% | 9.25% | 0.66% | 4.23% |
| Income Tax Expense | -91.19M | -703.65M | -3.01B | -2.65B | 1.85B | 1.76B | 2.84B | 2.46B | 1.82B | 768.16M | 913.46M | 1.60B | 2.22B | 2.57B | 336.41M | -1.59B | 1.43B | 689.63M | 642.35M | 381.07M | 20.07M | 24.06M |
| Net Income | -1.05B | -38.62B | -16.64B | -14.41B | 6.41B | 7.34B | 7.24B | 6.81B | 6.77B | 3.82B | 3.32B | 4.91B | 7.48B | 12.21B | 5.03B | -9.15B | 3.70B | 2.98B | 1.71B | 2.56B | 215.43M | 827.81M |
| Net Income Ratio | -0.74% | -73.01% | -22.33% | -20.73% | 4.71% | 5.36% | 5.97% | 5.98% | 6.22% | 3.64% | 3.40% | 4.92% | 7.70% | 15.08% | 9.84% | -17.27% | 7.44% | 6.33% | 4.26% | 7.35% | 0.89% | 3.34% |
| EPS | -0.07 | -56.20 | -1.21 | -1.05 | 0.47 | 10.60 | 10.80 | 11.00 | 11.00 | 6.20 | 5.40 | 8.00 | 12.20 | 21.00 | 8.40 | -15.40 | 6.20 | 5.81 | 3.62 | 0.57 | 0.00 | 0.00 |
| EPS Diluted | -0.07 | -56.20 | -1.21 | -1.05 | 0.47 | 10.60 | 10.80 | 11.00 | 11.00 | 6.20 | 5.40 | 8.00 | 12.20 | 21.00 | 8.40 | -15.40 | 6.20 | 5.81 | 3.62 | 0.57 | 0.00 | 0.00 |
| Weighted Avg Shares Out | 15.40B | 14.52B | 14.52B | 14.52B | 14.52B | 14.52B | 14.52B | 14.52B | 14.52B | 14.52B | 14.52B | 14.52B | 14.52B | 14.52B | 14.52B | 14.52B | 14.52B | 14.52B | 14.52B | 14.52B | 14.52B | 14.52B |
| Weighted Avg Shares Out (Dil) | 15.40B | 14.52B | 14.52B | 14.52B | 14.52B | 14.52B | 14.52B | 14.52B | 14.52B | 14.52B | 14.52B | 14.52B | 14.52B | 14.52B | 14.52B | 14.52B | 14.52B | 14.52B | 14.52B | 14.52B | 14.52B | 14.52B |

COMAC says Air China will be launch customer of C929 widebody jet

Air China: A Stock To Buy If You Do Not Fear China Exposure

Are Investors Undervaluing Air China (AIRYY) Right Now?

The 3 Penny Stocks That Could Make Your February Unforgettable

3 Beaten-Down Transportation Stocks That Could be Winners in 2024

Looking for growth? It's here, 2 stocks you could finally own

The only two airline stocks worth buying: One is a Goldman pick

The 3 Stocks To Play China's Return To Travel
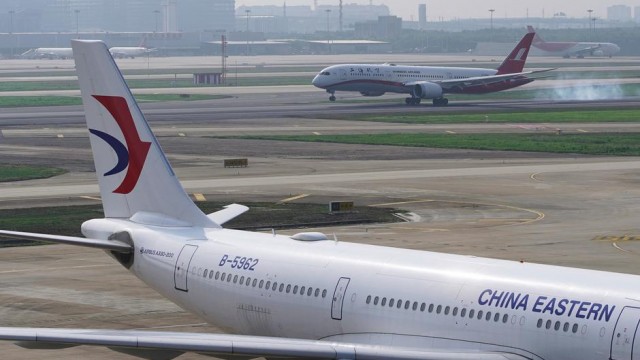
China's top airlines post wider 2021 losses amid drive to stamp out COVID

7 Stocks to Sell as Global Tensions Rise
Source: https://incomestatements.info
Category: Stock Reports
