See more : BANNARI AMMAN SPINNING MILLS L (BASML-RE.NS) Income Statement Analysis – Financial Results
Complete financial analysis of AppHarvest, Inc. (APPH) income statement, including revenue, profit margins, EPS and key performance metrics. Get detailed insights into the financial performance of AppHarvest, Inc., a leading company in the Agricultural Farm Products industry within the Consumer Defensive sector.
- Citychamp Dartong Co.,Ltd. (600067.SS) Income Statement Analysis – Financial Results
- DelphX Capital Markets Inc. (DPXCF) Income Statement Analysis – Financial Results
- Tri-Continental Corporation PFD $2.50 (TY-P) Income Statement Analysis – Financial Results
- Hangzhou Pinming Software Co., Ltd (688109.SS) Income Statement Analysis – Financial Results
- Xelpmoc Design and Tech Limited (XELPMOC.NS) Income Statement Analysis – Financial Results
AppHarvest, Inc. (APPH)
About AppHarvest, Inc.
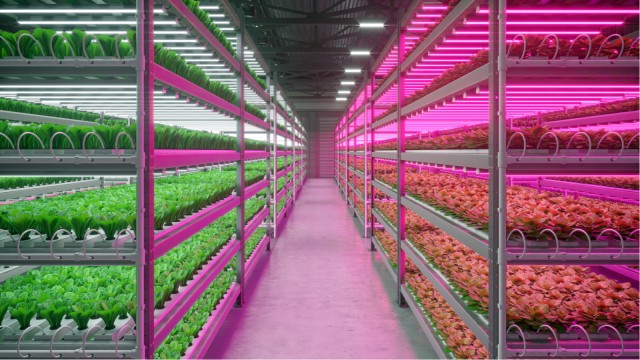
AppHarvest, Inc., an applied agricultural technology company, develops and operates indoor farms to grow non-GMO produce free of chemical pesticide residues. Its products include tomatoes; and other fruits and vegetables, such as berries, peppers, cucumbers, and salad greens. The company was incorporated in 2018 and is based in Morehead, Kentucky.
| Metric | 2022 | 2021 | 2020 |
|---|---|---|---|
| Revenue | 14.59M | 9.05M | 0.00 |
| Cost of Revenue | 57.00M | 41.94M | 0.00 |
| Gross Profit | -42.40M | -32.89M | 0.00 |
| Gross Profit Ratio | -290.59% | -363.40% | 0.00% |
| Research & Development | 0.00 | 0.00 | 0.00 |
| General & Administrative | 0.00 | 0.00 | 0.00 |
| Selling & Marketing | 0.00 | 0.00 | 0.00 |
| SG&A | 81.27M | 107.25M | 16.30M |
| Other Expenses | -480.00K | 448.00K | 176.00K |
| Operating Expenses | 81.27M | 107.25M | 16.47M |
| Cost & Expenses | 138.26M | 149.18M | 16.47M |
| Interest Income | 0.00 | 0.00 | 0.00 |
| Interest Expense | 49.99M | 658.00K | 1.42M |
| Depreciation & Amortization | 65.98M | 71.14M | 631.00K |
| EBITDA | -107.80M | -128.89M | -15.84M |
| EBITDA Ratio | -738.73% | -1,424.21% | 0.00% |
| Operating Income | -173.77M | -200.03M | -16.47M |
| Operating Income Ratio | -1,190.86% | -2,210.32% | 0.00% |
| Total Other Income/Expenses | -369.00K | 34.84M | -968.00K |
| Income Before Tax | -174.14M | -165.20M | -17.44M |
| Income Before Tax Ratio | -1,193.39% | -1,825.38% | 0.00% |
| Income Tax Expense | 2.51M | 989.00K | 9.00K |
| Net Income | -176.65M | -166.19M | -17.45M |
| Net Income Ratio | -1,210.57% | -1,836.31% | 0.00% |
| EPS | -1.69 | -1.74 | -0.46 |
| EPS Diluted | -1.69 | -1.74 | -0.46 |
| Weighted Avg Shares Out | 104.76M | 95.57M | 38.07M |
| Weighted Avg Shares Out (Dil) | 104.76M | 95.57M | 38.07M |

AppHarvest announces proposed $40 million public offering of common stock

3 Hot Stocks That Have Already Doubled in 2023

Are Business Services Stocks Lagging AppHarvest (APPH) This Year?

7 Heavily Shorted Penny Stocks for Your Short-Squeeze Watch List

5 Big Winners as Wall Street Wraps Up Strong January Gains

Why AppHarvest Jumped 60.5% This Week

Local Bounti Vs. AppHarvest: Which Sustainable Farmer Will Grow Alpha?

AppHarvest begins commercial shipments from first harvest at new Richmond, Ky., 60-acre high-tech indoor farm

4 Best Vertical Farming Stocks to Buy Now

Is AppHarvest (APPH) Outperforming Other Business Services Stocks This Year?
Source: https://incomestatements.info
Category: Stock Reports
