See more : Fifth Street Asset Management Inc. (FSAM) Income Statement Analysis – Financial Results
Complete financial analysis of AppHarvest, Inc. (APPH) income statement, including revenue, profit margins, EPS and key performance metrics. Get detailed insights into the financial performance of AppHarvest, Inc., a leading company in the Agricultural Farm Products industry within the Consumer Defensive sector.
- Beijing Enterprises Holdings Limited (0392.HK) Income Statement Analysis – Financial Results
- Magseis Fairfield ASA (MSEIF) Income Statement Analysis – Financial Results
- Beijing Tong Ren Tang Chinese Medicine Company Limited (3613.HK) Income Statement Analysis – Financial Results
- Nanofilm Technologies International Limited (MZH.SI) Income Statement Analysis – Financial Results
- Systems Design Co., Ltd. (3766.T) Income Statement Analysis – Financial Results
AppHarvest, Inc. (APPH)
About AppHarvest, Inc.
AppHarvest, Inc., an applied agricultural technology company, develops and operates indoor farms to grow non-GMO produce free of chemical pesticide residues. Its products include tomatoes; and other fruits and vegetables, such as berries, peppers, cucumbers, and salad greens. The company was incorporated in 2018 and is based in Morehead, Kentucky.
| Metric | 2022 | 2021 | 2020 |
|---|---|---|---|
| Revenue | 14.59M | 9.05M | 0.00 |
| Cost of Revenue | 57.00M | 41.94M | 0.00 |
| Gross Profit | -42.40M | -32.89M | 0.00 |
| Gross Profit Ratio | -290.59% | -363.40% | 0.00% |
| Research & Development | 0.00 | 0.00 | 0.00 |
| General & Administrative | 0.00 | 0.00 | 0.00 |
| Selling & Marketing | 0.00 | 0.00 | 0.00 |
| SG&A | 81.27M | 107.25M | 16.30M |
| Other Expenses | -480.00K | 448.00K | 176.00K |
| Operating Expenses | 81.27M | 107.25M | 16.47M |
| Cost & Expenses | 138.26M | 149.18M | 16.47M |
| Interest Income | 0.00 | 0.00 | 0.00 |
| Interest Expense | 49.99M | 658.00K | 1.42M |
| Depreciation & Amortization | 65.98M | 71.14M | 631.00K |
| EBITDA | -107.80M | -128.89M | -15.84M |
| EBITDA Ratio | -738.73% | -1,424.21% | 0.00% |
| Operating Income | -173.77M | -200.03M | -16.47M |
| Operating Income Ratio | -1,190.86% | -2,210.32% | 0.00% |
| Total Other Income/Expenses | -369.00K | 34.84M | -968.00K |
| Income Before Tax | -174.14M | -165.20M | -17.44M |
| Income Before Tax Ratio | -1,193.39% | -1,825.38% | 0.00% |
| Income Tax Expense | 2.51M | 989.00K | 9.00K |
| Net Income | -176.65M | -166.19M | -17.45M |
| Net Income Ratio | -1,210.57% | -1,836.31% | 0.00% |
| EPS | -1.69 | -1.74 | -0.46 |
| EPS Diluted | -1.69 | -1.74 | -0.46 |
| Weighted Avg Shares Out | 104.76M | 95.57M | 38.07M |
| Weighted Avg Shares Out (Dil) | 104.76M | 95.57M | 38.07M |

AppHarvest unanimously appoints Kevin Willis to Board of Directors
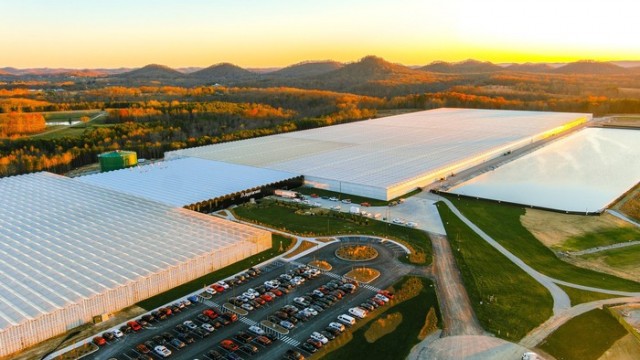
Why AppHarvest Shares Are Plunging Today
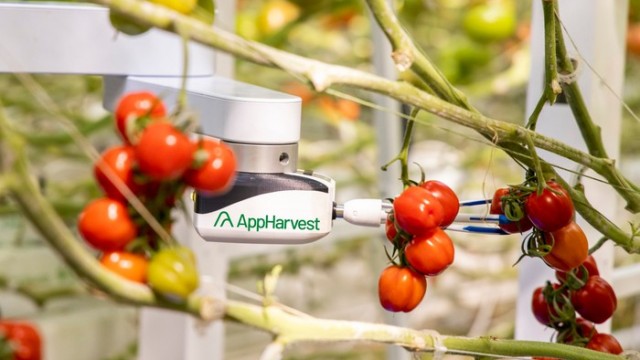
AppHarvest Stock Plunges After Preliminary FY21 Results

AppHarvest announces preliminary FY 2021 net sales and Adjusted EBITDA at higher end of guidance as it marks first anniversary operating as public company

This Recent SPAC Is My Favorite Breakout Stock for 2022

ROBO: Beware Of Risks Surrounding The Seemingly Promising Theme

AppHarvest: The Future Of Human Farming Calls
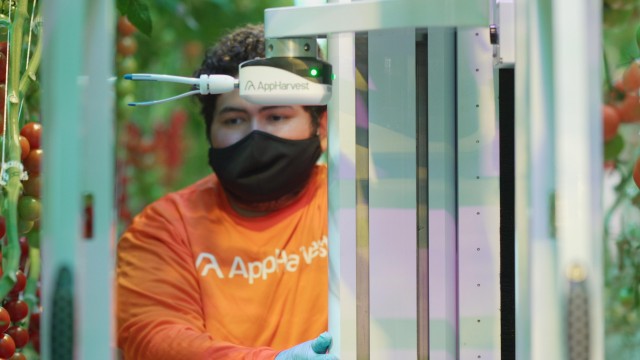
AppHarvest: Transforming The Future Of Agtech, And Maybe The Future Of Farm Work
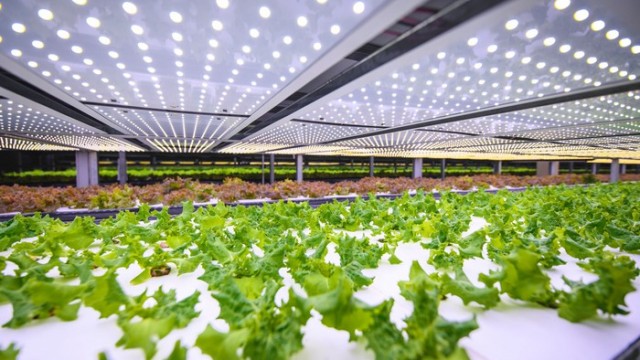
AppHarvest Stock (APPH): Why The Stock Price Fell Today

AppHarvest enhances liquidity through $100 million committed equity facility with B. Riley Principal Capital and re-affirms 2021 outlook and construction timeline
Source: https://incomestatements.info
Category: Stock Reports
