See more : Qlife Holding AB (publ) (QLIFE.ST) Income Statement Analysis – Financial Results
Complete financial analysis of AERWINS Technologies Inc. (AWIN) income statement, including revenue, profit margins, EPS and key performance metrics. Get detailed insights into the financial performance of AERWINS Technologies Inc., a leading company in the Hardware, Equipment & Parts industry within the Technology sector.
- Tele2 AB (publ) (TEL2-A.ST) Income Statement Analysis – Financial Results
- NOROO PAINT & COATINGS Co., Ltd. (090350.KS) Income Statement Analysis – Financial Results
- Valqua, Ltd. (7995.T) Income Statement Analysis – Financial Results
- Wendel (WNDLF) Income Statement Analysis – Financial Results
- Raaj Medisafe India Limited (RAAJMEDI.BO) Income Statement Analysis – Financial Results
AERWINS Technologies Inc. (AWIN)
About AERWINS Technologies Inc.
AERWINS Technologies Inc. engages in redesigning single-seat optionally manned air vehicle in the United States. The company is based in Los Angeles, California.
| Metric | 2023 | 2022 | 2021 | 2020 |
|---|---|---|---|---|
| Revenue | 0.00 | 5.21M | 7.83M | 9.92M |
| Cost of Revenue | 0.00 | 5.07M | 6.43M | 6.80M |
| Gross Profit | 0.00 | 136.98K | 1.40M | 3.13M |
| Gross Profit Ratio | 0.00% | 2.63% | 17.83% | 31.51% |
| Research & Development | 0.00 | 8.93M | 9.34M | 7.51M |
| General & Administrative | 9.46M | 7.06M | 5.81M | 6.93M |
| Selling & Marketing | 63.00 | 90.65K | 259.80K | 98.92K |
| SG&A | 9.46M | 2.10M | 6.07M | 7.03M |
| Other Expenses | 0.00 | -200.00K | -1.03M | 13.89K |
| Operating Expenses | 7.81M | 2.30M | 15.40M | 14.54M |
| Cost & Expenses | 7.81M | 2.30M | 21.84M | 21.34M |
| Interest Income | 1.70M | 1.70M | 3.21K | 0.00 |
| Interest Expense | 0.00 | 8.32K | 0.00 | 0.00 |
| Depreciation & Amortization | 274.16K | 379.39K | 254.72K | 341.16K |
| EBITDA | -9.19M | -2.30M | -13.78M | -11.07M |
| EBITDA Ratio | 0.00% | -44.21% | -182.98% | -97.77% |
| Operating Income | -9.46M | -2.30M | -14.01M | -11.41M |
| Operating Income Ratio | 0.00% | -44.21% | -178.90% | -115.01% |
| Total Other Income/Expenses | -51.13K | 5.32M | -488.03K | -1.38M |
| Income Before Tax | -9.52M | 3.02M | -14.50M | -12.79M |
| Income Before Tax Ratio | 0.00% | 58.03% | -185.13% | -128.87% |
| Income Tax Expense | 0.00 | 289.12K | 31.14K | 23.13K |
| Net Income | -9.52M | 2.73M | -14.56M | -12.55M |
| Net Income Ratio | 0.00% | 52.48% | -185.89% | -126.43% |
| EPS | -16.18 | 9.57 | -55.26 | -49.22 |
| EPS Diluted | -16.18 | 9.57 | -55.26 | -49.22 |
| Weighted Avg Shares Out | 588.06K | 285.65K | 263.42K | 254.92K |
| Weighted Avg Shares Out (Dil) | 588.06K | 285.65K | 263.42K | 254.92K |

Why Is Aerwins Technologies (AWIN) Stock Down 54% Today?
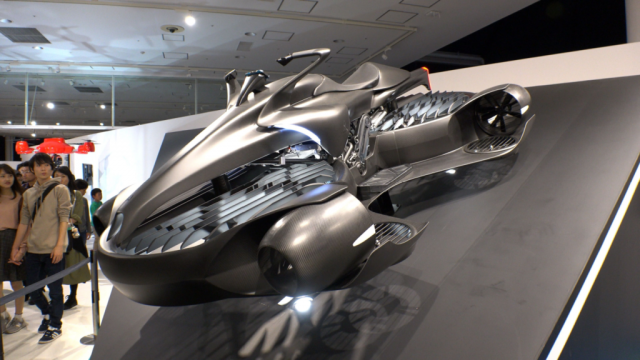
Is Aerwins Technologies (AWIN) Stock the Next Big Short Squeeze?

AERWINS Technologies Announces Additional Staff Determination

AERWINS Technologies Announces 1-For-100 Reverse Stock Split
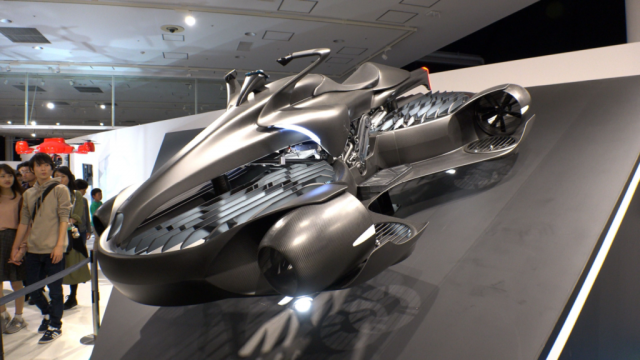
Why Is Aerwins Technologies (AWIN) Stock Up 26% Today?

AERWINS Plans to Obtain XTURISMO FAA Approval Established US Subsidiary
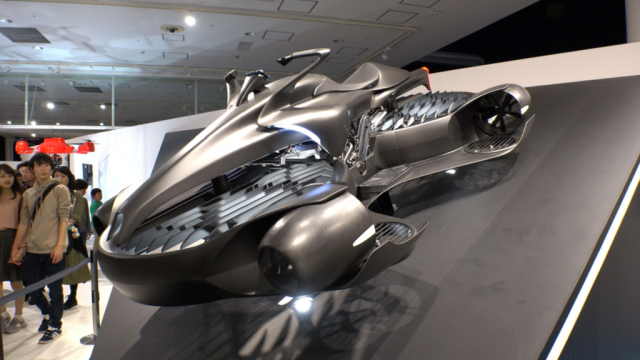
Why Is Aerwins Technologies (AWIN) Stock Down 18% Today?
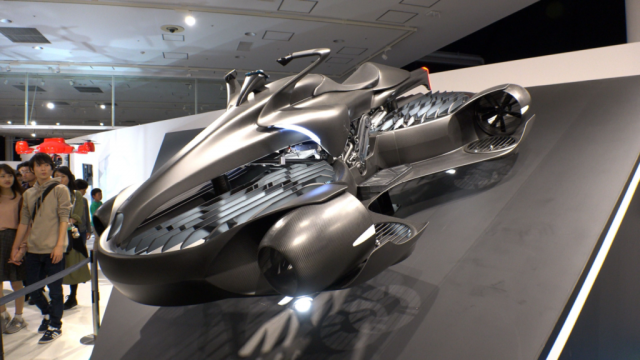
Why Is Aerwins Technologies (AWIN) Stock Up 112% Today?
Should You Buy Penny Stocks Right Now? 3 Reasons

Aerwins Patented Air Mobility Platform to Revolutionize Low Altitude Flights for Vehicles Opening Flight Possibilities for Electric Vehicles
Source: https://incomestatements.info
Category: Stock Reports
