See more : Poddar Pigments Limited (PODARPIGQ.BO) Income Statement Analysis – Financial Results
Complete financial analysis of Beiersdorf Aktiengesellschaft (BDRFY) income statement, including revenue, profit margins, EPS and key performance metrics. Get detailed insights into the financial performance of Beiersdorf Aktiengesellschaft, a leading company in the Household & Personal Products industry within the Consumer Defensive sector.
- Cargosol Logistics Limited (CARGOSOL.BO) Income Statement Analysis – Financial Results
- Zamet S.A. (ZMT.WA) Income Statement Analysis – Financial Results
- Beijing Caishikou Department Store Co.,Ltd. (605599.SS) Income Statement Analysis – Financial Results
- Lloyds Engineering Works Limited (LLOYDSENGG.BO) Income Statement Analysis – Financial Results
- Radial Research Corp. (RADLF) Income Statement Analysis – Financial Results
Beiersdorf Aktiengesellschaft (BDRFY)
Industry: Household & Personal Products
Sector: Consumer Defensive
Website: https://www.beiersdorf.com
About Beiersdorf Aktiengesellschaft
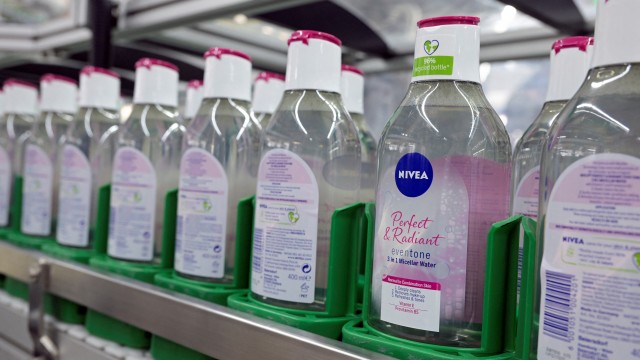
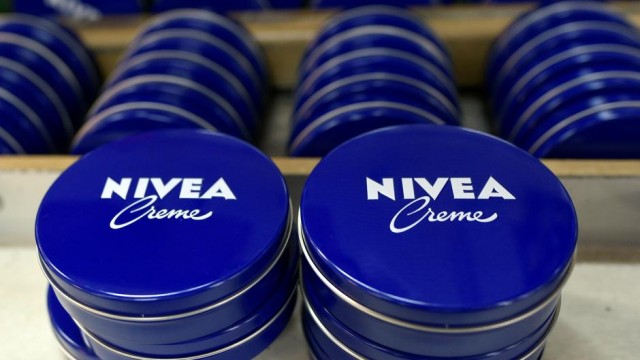
Beiersdorf Aktiengesellschaft engages in the manufacture and distribution of consumer goods in Europe, the Americas, Africa, Asia, and Australia. It operates in two segments, Consumer Business and Tesa Business. The Consumer Business Segment offers skin and body care products. The Tesa Business segment provides adhesive tapes and self-adhesive products and system solutions for industries, craft businesses, and consumers. This segment offers its system solutions to the automotive, electronics, printing and paper, and building and construction industries. It offers its products under the NIVEA, Eucerin, La Prairie, Labello, Hansaplast, 8x4, FLORENA, Coppertone, HIDROFUGAL, GAMMON, SKIN STORIES, FLORENA FERMENTED SKINCARE, STOP THE WATER WHILE USING ME, CHAUL, TESA, O.W.N., Chantecaille, Elastoplast, CURITAS, and Beiersdorf brands. The company was founded in 1882 and is headquartered in Hamburg, Germany. Beiersdorf Aktiengesellschaft is a subsidiary of maxingvest ag.
| Metric | 2023 | 2022 | 2021 | 2020 | 2019 | 2018 | 2017 | 2016 | 2015 | 2014 | 2013 | 2012 | 2011 | 2010 | 2009 | 2008 | 2007 | 2006 | 2005 | 2004 | 2003 | 2002 |
|---|---|---|---|---|---|---|---|---|---|---|---|---|---|---|---|---|---|---|---|---|---|---|
| Revenue | 9.45B | 8.80B | 7.63B | 7.03B | 7.65B | 7.23B | 7.06B | 6.75B | 6.69B | 6.29B | 6.14B | 6.04B | 5.63B | 6.19B | 5.75B | 5.97B | 5.51B | 5.12B | 4.78B | 4.55B | 4.67B | 4.74B |
| Cost of Revenue | 4.03B | 3.84B | 3.27B | 2.98B | 3.22B | 3.08B | 2.91B | 2.77B | 2.79B | 2.37B | 2.26B | 2.22B | 2.08B | 2.02B | 1.88B | 1.98B | 1.83B | -1.74B | -1.66B | -1.61B | 1.70B | 1.76B |
| Gross Profit | 5.42B | 4.96B | 4.36B | 4.04B | 4.43B | 4.16B | 4.15B | 3.98B | 3.90B | 3.92B | 3.89B | 3.82B | 3.56B | 4.18B | 3.87B | 3.99B | 3.68B | 6.86B | 6.43B | 6.16B | 2.98B | 2.99B |
| Gross Profit Ratio | 57.33% | 56.34% | 57.17% | 57.52% | 57.91% | 57.49% | 58.76% | 58.92% | 58.35% | 62.34% | 63.28% | 63.29% | 63.13% | 67.45% | 67.26% | 66.86% | 66.77% | 133.91% | 134.72% | 135.48% | 63.66% | 62.97% |
| Research & Development | 320.00M | 291.00M | 268.00M | 246.00M | 236.00M | 211.00M | 196.00M | 188.00M | 183.00M | 168.00M | 154.00M | 159.00M | 163.00M | 152.00M | 149.00M | 149.00M | 127.00M | -118.00M | -109.00M | -101.00M | 100.00M | 93.00M |
| General & Administrative | 570.00M | 524.00M | 448.00M | 400.00M | 416.00M | 404.00M | 395.00M | 364.00M | 366.00M | 330.00M | 312.00M | 311.00M | 293.00M | 278.00M | 283.00M | 292.00M | 260.00M | 245.00M | 0.00 | 0.00 | 251.00M | 260.00M |
| Selling & Marketing | 3.25B | 3.00B | 2.68B | 2.49B | 2.67B | 2.48B | 2.47B | 2.41B | 2.43B | 2.60B | 2.61B | 2.54B | 2.45B | 2.96B | 2.77B | 2.87B | 2.62B | -2.41B | -2.20B | -2.09B | 2.09B | 2.10B |
| SG&A | 3.83B | 3.52B | 3.12B | 2.89B | 3.08B | 2.89B | 2.87B | 2.77B | 2.80B | 2.93B | 2.92B | 2.85B | 2.75B | 3.24B | 3.05B | 3.17B | 2.88B | -2.41B | -2.20B | -2.09B | 2.34B | 2.36B |
| Other Expenses | 159.00M | -56.00M | -5.00M | 26.00M | 27.00M | -10.00M | 46.00M | -17.00M | -24.00M | -12.00M | -12.00M | -12.00M | -2.00M | -6.00M | -10.00M | -19.00M | 56.00M | 374.00M | 4.00M | 9.00M | 30.00M | 12.00M |
| Operating Expenses | 4.31B | 3.76B | 3.39B | 3.16B | 3.35B | 3.09B | 3.06B | 2.94B | 2.96B | 3.13B | 3.06B | 3.04B | 3.13B | 3.60B | 3.28B | 3.30B | 3.06B | -2.53B | -2.31B | -2.19B | 2.49B | 2.51B |
| Cost & Expenses | 8.34B | 7.60B | 6.65B | 6.14B | 6.57B | 6.16B | 5.97B | 5.72B | 5.74B | 5.49B | 5.31B | 5.26B | 5.20B | 5.61B | 5.16B | 5.28B | 4.89B | -4.26B | -3.97B | -3.80B | 4.19B | 4.27B |
| Interest Income | 43.00M | 36.00M | 32.00M | 33.00M | 37.00M | 35.00M | 35.00M | 30.00M | 25.00M | 32.00M | 23.00M | 37.00M | 31.00M | 19.00M | 21.00M | 55.00M | 72.00M | 38.00M | 0.00 | 0.00 | 3.00M | 11.00M |
| Interest Expense | 26.00M | 16.00M | 14.00M | 13.00M | 13.00M | 9.00M | 8.00M | 4.00M | 14.00M | 7.00M | 6.00M | 9.00M | 19.00M | 13.00M | 15.00M | 14.00M | 44.00M | 35.00M | 0.00 | 0.00 | 18.00M | 17.00M |
| Depreciation & Amortization | 449.00M | 279.00M | 278.00M | 247.00M | 239.00M | 165.00M | 150.00M | 148.00M | 129.00M | 179.00M | 106.00M | 152.00M | 273.00M | 221.00M | 135.00M | 114.00M | 122.00M | 183.00M | 162.00M | 173.00M | 164.00M | 161.00M |
| EBITDA | 1.58B | 1.40B | 1.21B | 1.09B | 1.29B | 1.22B | 1.23B | 1.18B | 1.08B | 997.00M | 934.00M | 874.00M | 732.00M | 787.00M | 733.00M | 849.00M | 777.00M | 1.07B | 4.13B | 3.97B | 681.00M | 656.00M |
| EBITDA Ratio | 16.72% | 16.46% | 16.55% | 16.26% | 17.40% | 16.72% | 16.77% | 18.05% | 16.42% | 15.94% | 15.39% | 15.15% | 12.99% | 12.71% | 12.75% | 14.22% | 14.71% | 86.84% | 86.45% | 87.42% | 14.57% | 13.83% |
| Operating Income | 1.11B | 1.09B | 933.00M | 828.00M | 1.03B | 1.10B | 1.09B | 1.02B | 962.00M | 796.00M | 820.00M | 698.00M | 431.00M | 583.00M | 587.00M | 797.00M | 616.00M | 477.00M | 531.00M | 483.00M | 484.00M | 472.00M |
| Operating Income Ratio | 11.70% | 12.41% | 12.23% | 11.79% | 13.48% | 15.17% | 15.42% | 15.03% | 14.39% | 12.67% | 13.35% | 11.56% | 7.65% | 9.41% | 10.21% | 13.35% | 11.19% | 9.32% | 11.12% | 10.62% | 10.36% | 9.95% |
| Total Other Income/Expenses | 0.00 | 4.00M | -26.00M | -7.00M | 5.00M | -49.00M | -66.00M | 25.00M | 6.00M | 15.00M | -5.00M | -85.00M | 9.00M | -30.00M | -4.00M | 25.00M | 28.00M | 374.00M | 4.00M | 9.00M | 15.00M | 6.00M |
| Income Before Tax | 1.11B | 1.10B | 907.00M | 821.00M | 1.04B | 1.05B | 1.02B | 1.04B | 968.00M | 811.00M | 815.00M | 709.00M | 440.00M | 553.00M | 583.00M | 822.00M | 644.00M | 851.00M | 535.00M | 492.00M | 499.00M | 478.00M |
| Income Before Tax Ratio | 11.70% | 12.46% | 11.89% | 11.69% | 13.55% | 14.49% | 14.48% | 15.40% | 14.48% | 12.90% | 13.27% | 11.74% | 7.81% | 8.93% | 10.14% | 13.77% | 11.69% | 16.62% | 11.20% | 10.82% | 10.68% | 10.08% |
| Income Tax Expense | 356.00M | 325.00M | 252.00M | 244.00M | 301.00M | 303.00M | 333.00M | 313.00M | 297.00M | 274.00M | 272.00M | 258.00M | 181.00M | 227.00M | 203.00M | 255.00M | 202.00M | 183.00M | 200.00M | 190.00M | 198.00M | 188.00M |
| Net Income | 736.00M | 755.00M | 638.00M | 560.00M | 718.00M | 728.00M | 672.00M | 709.00M | 660.00M | 529.00M | 534.00M | 445.00M | 250.00M | 318.00M | 374.00M | 562.00M | 437.00M | 664.00M | 329.00M | 296.00M | 294.00M | 283.00M |
| Net Income Ratio | 7.79% | 8.58% | 8.37% | 7.97% | 9.38% | 10.06% | 9.52% | 10.50% | 9.87% | 8.42% | 8.70% | 7.37% | 4.44% | 5.13% | 6.51% | 9.41% | 7.94% | 12.97% | 6.89% | 6.51% | 6.29% | 5.97% |
| EPS | 3.24 | 3.33 | 2.81 | 2.47 | 3.17 | 0.64 | 0.59 | 0.63 | 0.58 | 0.47 | 0.47 | 0.39 | 0.23 | 0.29 | 0.34 | 0.50 | 0.39 | 0.59 | 0.29 | 0.26 | 0.23 | 0.23 |
| EPS Diluted | 3.24 | 3.33 | 2.81 | 2.47 | 3.17 | 0.64 | 0.59 | 0.63 | 0.58 | 0.47 | 0.47 | 0.39 | 0.23 | 0.29 | 0.34 | 0.50 | 0.39 | 0.59 | 0.29 | 0.26 | 0.23 | 0.23 |
| Weighted Avg Shares Out | 226.82M | 226.82M | 226.82M | 226.82M | 226.82M | 1.13B | 1.13B | 1.13B | 1.13B | 1.13B | 1.13B | 1.13B | 1.13B | 1.13B | 1.13B | 1.13B | 1.13B | 1.13B | 1.13B | 1.13B | 1.26B | 1.26B |
| Weighted Avg Shares Out (Dil) | 226.82M | 226.82M | 226.82M | 226.82M | 226.82M | 1.13B | 1.13B | 1.13B | 1.13B | 1.13B | 1.13B | 1.13B | 1.13B | 1.13B | 1.13B | 1.13B | 1.13B | 1.13B | 1.13B | 1.13B | 1.26B | 1.26B |

Beiersdorf Aktiengesellschaft (BDRFF) Q3 2024 Earnings Call Transcript

Beiersdorf Aktiengesellschaft (BDRFF) Q2 2024 Earnings Call Transcript

3 Beauty and Cosmetics Stocks to Invest In for Glowing Returns

Beiersdorf warns of slowing sales growth

Beiersdorf Aktiengesellschaft (BDRFF) Q3 2023 Earnings Call Transcript

Beiersdorf Aktiengesellschaft (BDRFF) Q2 2023 Earnings Call Transcript

Beiersdorf Aktiengesellschaft (BDRFF) Q1 2023 Earnings Call Transcript

Beiersdorf Aktiengesellschaft (BDRFF) Q3 2022 Earnings Call Transcript

Beiersdorf Aktiengesellschaft (BDRFF) CEO Vincent Warnery on Q2 2022 Results - Earnings Call Transcript

Beiersdorf posts 10.5% organic sales growth in H1, affirms outlook
Source: https://incomestatements.info
Category: Stock Reports
