See more : Buyer Group International, Inc. (BYRG) Income Statement Analysis – Financial Results
Complete financial analysis of BP Midstream Partners LP (BPMP) income statement, including revenue, profit margins, EPS and key performance metrics. Get detailed insights into the financial performance of BP Midstream Partners LP, a leading company in the Oil & Gas Midstream industry within the Energy sector.
- Adastra Holdings Ltd. (XTRX.CN) Income Statement Analysis – Financial Results
- SDI Limited (SDI.AX) Income Statement Analysis – Financial Results
- Public joint-stock company Beluga Group (BELU.ME) Income Statement Analysis – Financial Results
- JNBY Design Limited (3306.HK) Income Statement Analysis – Financial Results
- Asarina Pharma AB (publ) (ASRPF) Income Statement Analysis – Financial Results
BP Midstream Partners LP (BPMP)
Industry: Oil & Gas Midstream
Sector: Energy
Website: https://www.bp.com/en/global/bp-midstream-partners.html
About BP Midstream Partners LP
BP Midstream Partners LP owns, acquires, develops, and operates pipelines and other midstream assets in the United States. Its assets consist of interests in entities that own crude oil, natural gas, refined products, and diluent pipelines, as well as refined product terminals to transport onshore crude oil production to refinery in Whiting, Indiana as well as offshore crude oil and natural gas production to refining markets, and trading and distribution hubs. BP Midstream Partners GP LLC serves as a general partner of BP Midstream Partners LP. The company was incorporated in 2017 and is based in Houston, Texas.
| Metric | 2021 | 2020 | 2019 | 2018 | 2017 | 2016 | 2015 |
|---|---|---|---|---|---|---|---|
| Revenue | 119.00M | 128.90M | 128.47M | 116.44M | 108.15M | 103.00M | 106.78M |
| Cost of Revenue | 0.00 | 25.90M | 24.36M | 21.94M | 23.74M | 19.66M | 20.79M |
| Gross Profit | 119.00M | 103.00M | 104.11M | 94.50M | 84.41M | 83.34M | 85.99M |
| Gross Profit Ratio | 100.00% | 79.91% | 81.04% | 81.15% | 78.05% | 80.91% | 80.53% |
| Research & Development | 0.00 | 0.00 | 0.00 | 0.00 | 0.00 | 0.00 | 0.00 |
| General & Administrative | 4.00M | 16.90M | 16.94M | 18.65M | 7.57M | 8.16M | 8.13M |
| Selling & Marketing | 0.00 | 0.00 | 0.00 | 0.00 | 0.00 | 0.00 | 0.00 |
| SG&A | 4.00M | 16.90M | 16.94M | 18.65M | 7.57M | 8.16M | 8.13M |
| Other Expenses | 11.00M | 700.00K | 722.00K | 483.00K | 393.00K | 366.00K | 364.00K |
| Operating Expenses | 15.00M | 17.60M | 17.66M | 19.14M | 7.96M | 8.53M | 8.49M |
| Cost & Expenses | 47.00M | 43.50M | 42.02M | 41.08M | 31.70M | 28.19M | 29.29M |
| Interest Income | 0.00 | 0.00 | 0.00 | 0.00 | 0.00 | 0.00 | 0.00 |
| Interest Expense | 4.00M | 7.90M | 15.13M | 4.04M | 107.00K | 0.00 | 0.00 |
| Depreciation & Amortization | 105.80M | 2.50M | 2.63M | 2.66M | 2.67M | 2.60M | 2.50M |
| EBITDA | 178.00M | 178.80M | 185.64M | 139.76M | 49.87M | 77.94M | 79.37M |
| EBITDA Ratio | 149.58% | 138.71% | 144.50% | 120.03% | 46.11% | 75.67% | 74.33% |
| Operating Income | 72.20M | 85.40M | 85.45M | 75.36M | 76.46M | 74.82M | 77.49M |
| Operating Income Ratio | 60.67% | 66.25% | 66.51% | 64.72% | 70.70% | 72.63% | 72.57% |
| Total Other Income/Expenses | 101.80M | 102.90M | 101.62M | 90.32M | 17.83M | 520.00K | -622.00K |
| Income Before Tax | 174.00M | 188.30M | 187.07M | 165.68M | 94.29M | 75.34M | 76.87M |
| Income Before Tax Ratio | 146.22% | 146.08% | 145.61% | 142.29% | 87.19% | 73.14% | 71.99% |
| Income Tax Expense | -105.80M | 110.80M | 116.75M | 94.36M | 25.32M | 29.47M | 30.13M |
| Net Income | 279.80M | 168.40M | 167.88M | 133.06M | 21.78M | 45.87M | 46.74M |
| Net Income Ratio | 235.13% | 130.64% | 130.68% | 114.27% | 20.13% | 44.53% | 43.77% |
| EPS | 2.67 | 1.61 | 1.60 | 1.27 | 0.21 | 0.44 | 0.45 |
| EPS Diluted | 2.67 | 1.61 | 1.60 | 1.27 | 0.21 | 0.44 | 0.45 |
| Weighted Avg Shares Out | 104.80M | 104.80M | 104.80M | 104.80M | 104.80M | 104.75M | 104.75M |
| Weighted Avg Shares Out (Dil) | 104.80M | 104.80M | 104.80M | 104.80M | 104.80M | 104.75M | 104.75M |

BP shares: 3 reasons I’ll avoid them
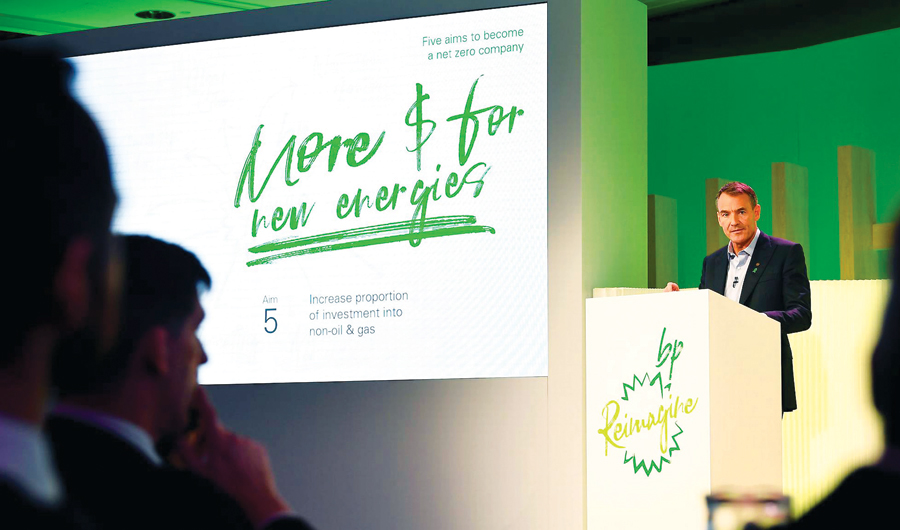
BP cuts dividend for the first time in a decade

Jim Cramer: 'I can't take how stupidly bullish this market can be'
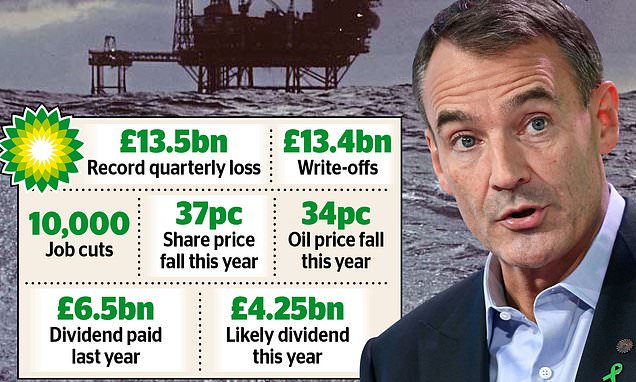
BP cuts dividend after record loss: New boss plots green revolution
BP’s climate crisis pledge lays down a marker for others to follow
After the BP dividend cut, where's left for the income-hunter?
BP reports second-quarter loss after major write downs, halves dividend - Oil & Gas 360

BP PLC (BP) CEO Bernard Looney on Q2 2020 Results - Earnings Call Transcript

Exxon Mobil: A Quarter That Investors Would Rather Forget (NYSE:XOM)
BP halves dividend after record loss, speeds up reinvention - business morphing to ESG compliance is not optional - Oil & Gas 360
Source: https://incomestatements.info
Category: Stock Reports
