See more : Pulstec Industrial Co., Ltd. (6894.T) Income Statement Analysis – Financial Results
Complete financial analysis of The Central and Eastern Europe Fund, Inc. (CEE) income statement, including revenue, profit margins, EPS and key performance metrics. Get detailed insights into the financial performance of The Central and Eastern Europe Fund, Inc., a leading company in the Asset Management industry within the Financial Services sector.
- Dingdang Health Technology Group Ltd. (9886.HK) Income Statement Analysis – Financial Results
- Metamaterial Exchangeco Inc. (MMAX.CN) Income Statement Analysis – Financial Results
- Genovis AB (publ.) (GENO.ST) Income Statement Analysis – Financial Results
- OLBA HEALTHCARE HOLDINGS, Inc. (2689.T) Income Statement Analysis – Financial Results
- Bloomage BioTechnology Corporation Limited (688363.SS) Income Statement Analysis – Financial Results
The Central and Eastern Europe Fund, Inc. (CEE)
Industry: Asset Management
Sector: Financial Services
Website: https://fundsus.deutscheam.com/EN/products/central-eastern-europe-fund.jsp?core-key=2506#
About The Central and Eastern Europe Fund, Inc.
The Central and Eastern Europe Fund, Inc. is a closed ended equity mutual fund launched by Deutsche Investment Management Americas Inc. The fund is managed by Deutsche Asset Management International GmbH. It invests in the public equity markets across Central and Eastern Europe. The fund seeks to invest in stocks of companies operating across diversified sectors. It benchmarks the performance of its portfolio against the CECE, RTX, and ISE National 30. The fund was formerly known as The Central Europe And Russia Fund, Inc. The Central and Eastern Europe Fund, Inc. was formed on March 6, 1990 and is domiciled in the United States.
| Metric | 2023 | 2022 | 2021 | 2020 | 2019 | 2018 | 2017 | 2016 | 2015 | 2014 | 2013 | 2012 | 2011 |
|---|---|---|---|---|---|---|---|---|---|---|---|---|---|
| Revenue | 18.15M | -175.72M | 91.23M | -53.85M | 38.71M | -164.29K | 43.15M | -20.53M | 6.52M | 8.87M | 13.73M | 15.69M | 0.00 |
| Cost of Revenue | 15.68M | 856.31K | 1.90M | 1.80M | 2.00M | 2.08M | 2.01M | 1.78M | 0.00 | 0.00 | 0.00 | 0.00 | 0.00 |
| Gross Profit | 2.48M | -176.58M | 89.33M | -55.65M | 36.72M | -2.24M | 41.14M | -22.31M | 6.52M | 8.87M | 13.73M | 15.69M | 0.00 |
| Gross Profit Ratio | 13.64% | 100.49% | 97.92% | 103.33% | 94.84% | 1,365.18% | 95.34% | 108.69% | 100.00% | 100.00% | 100.00% | 100.00% | 0.00% |
| Research & Development | 0.00 | 12.20 | 7.90 | -122.24 | 4.33 | -0.16 | 2.11 | -0.40 | 0.00 | 0.00 | 0.00 | 0.00 | 0.00 |
| General & Administrative | 457.37K | 843.28K | 973.85K | 976.07K | 1.13M | 1.17M | 1.22M | 2.19M | 2.74M | 4.29M | 5.29M | 5.56M | 0.00 |
| Selling & Marketing | 0.00 | 0.00 | 0.00 | 0.00 | 0.00 | 0.00 | 0.00 | 0.00 | 46.33K | 52.52K | 58.39K | 73.92K | 0.00 |
| SG&A | 457.37K | 843.28K | 973.85K | 976.07K | 1.13M | 1.17M | 1.22M | -0.40 | 2.79M | 4.34M | 5.35M | 5.64M | 0.00 |
| Other Expenses | 0.00 | -134.88K | 10.46K | 11.11K | 10.36K | 10.22K | 10.88K | 7.76M | 0.00 | 0.00 | 0.00 | 0.00 | 0.00 |
| Operating Expenses | 15.39M | 708.40K | 984.31K | 987.17K | 1.14M | 1.18M | 1.23M | 2.62M | 54.86M | 96.46M | 13.36M | 7.07M | 0.00 |
| Cost & Expenses | 18.15M | 708.40K | 984.31K | 987.17K | 1.14M | 1.18M | 1.23M | -22.31M | 54.86M | 96.46M | 13.36M | 7.07M | 0.00 |
| Interest Income | 0.00 | 0.00 | 0.00 | 0.00 | 0.00 | 0.00 | 0.00 | 0.00 | 0.00 | 0.00 | 0.00 | 0.00 | 0.00 |
| Interest Expense | 0.00 | 0.00 | 0.00 | 0.00 | 0.00 | 0.00 | 0.00 | 0.00 | 0.00 | 0.00 | 0.00 | 0.00 | 0.00 |
| Depreciation & Amortization | 0.00 | -1.91M | -5.78M | -6.65M | -8.94M | -7.08M | -3.96M | -3.40M | -3.73M | -4.53M | -8.38M | -10.05M | 0.00 |
| EBITDA | 17.85M | -176.43M | 0.00 | -54.84M | 0.00 | -1.34M | 0.00 | 4.84M | -52.07M | -92.12M | 18.71M | -1.44M | 0.00 |
| EBITDA Ratio | 98.34% | 100.40% | 98.92% | 101.83% | 97.06% | 815.42% | 97.14% | 140.62% | -798.27% | -1,038.77% | 136.29% | -9.16% | 0.00% |
| Operating Income | 17.85M | -176.43M | 90.25M | -54.84M | 37.58M | -1.34M | 41.92M | 3.40M | 3.73M | 4.53M | 8.38M | 10.05M | 0.00 |
| Operating Income Ratio | 98.34% | 100.40% | 98.92% | 101.83% | 97.06% | 815.42% | 97.14% | -16.57% | 57.26% | 51.05% | 61.05% | 64.06% | 0.00% |
| Total Other Income/Expenses | 14.55K | 0.00 | 0.00 | 0.00 | 0.00 | 2.08M | 0.00 | 4.84M | -52.07M | -92.12M | 18.71M | -1.44M | 0.00 |
| Income Before Tax | 17.87M | -176.43M | 90.25M | -54.84M | 37.58M | -1.34M | 41.92M | 8.24M | -48.33M | -87.59M | 27.09M | 8.61M | 0.00 |
| Income Before Tax Ratio | 98.42% | 100.40% | 98.92% | 101.83% | 97.06% | 815.42% | 97.14% | -40.15% | -741.02% | -987.72% | 197.34% | 54.90% | 0.00% |
| Income Tax Expense | 0.00 | 1.90M | 5.76M | 6.57M | 8.94M | -161.14K | 3.96M | -33.80M | -52.07M | -92.12M | 18.71M | -1.44M | 0.00 |
| Net Income | 17.87M | -176.43M | 90.25M | -54.84M | 37.58M | -1.34M | 41.92M | 8.34M | -48.33M | -87.59M | 27.09M | 8.61M | 0.00 |
| Net Income Ratio | 98.42% | 100.40% | 98.92% | 101.83% | 97.06% | 815.42% | 97.14% | -40.62% | -741.02% | -987.72% | 197.34% | 54.90% | 0.00% |
| EPS | 2.86 | -28.36 | 14.33 | -8.21 | 5.60 | -0.23 | 5.61 | 1.01 | -5.91 | -9.37 | 2.41 | 0.66 | 0.00 |
| EPS Diluted | 2.86 | -28.36 | 14.33 | -8.21 | 5.60 | -0.23 | 5.61 | 7.85M | -5.91 | -9.37 | 2.41 | 0.66 | 0.00 |
| Weighted Avg Shares Out | 6.25M | 6.22M | 6.30M | 6.68M | 6.71M | 5.82M | 7.23M | 8.24M | 8.17M | 9.35M | 11.23M | 13.13M | 13.57M |
| Weighted Avg Shares Out (Dil) | 6.25M | 6.22M | 6.30M | 6.68M | 6.71M | 5.82M | 7.47M | 1.06 | 8.17M | 9.35M | 11.23M | 13.13M | 13.57M |

The Central and Eastern Europe Fund, Inc. and The New Germany Fund, Inc. Announce Results of Each Fund’s Annual Meeting of Stockholders

The Central and Eastern Europe Fund, Inc., and The New Germany Fund, Inc. Announce Annual Meetings of Stockholders

Investing In Emerging Markets As Global Rates Rise

The Central and Eastern Europe Fund, Inc., The European Equity Fund, Inc., and The New Germany Fund, Inc. Make Yearly Distribution Announcements

The Central and Eastern Europe Fund, Inc., The European Equity Fund, Inc., and The New Germany Fund, Inc. Make Yearly Distribution Announcements

Closed-End Funds: Semi-Annual And Annual Distribution Payers
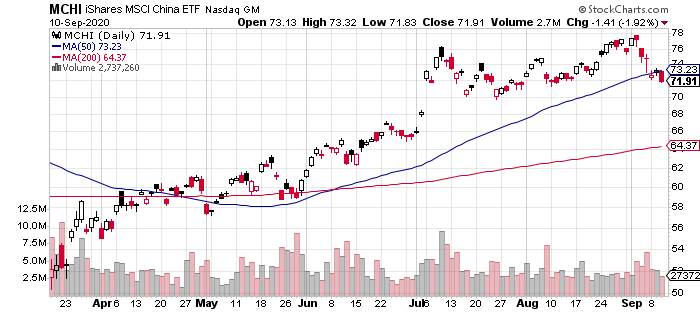
China Stocks Still Posting Wide Lead For Global Equities In 2020
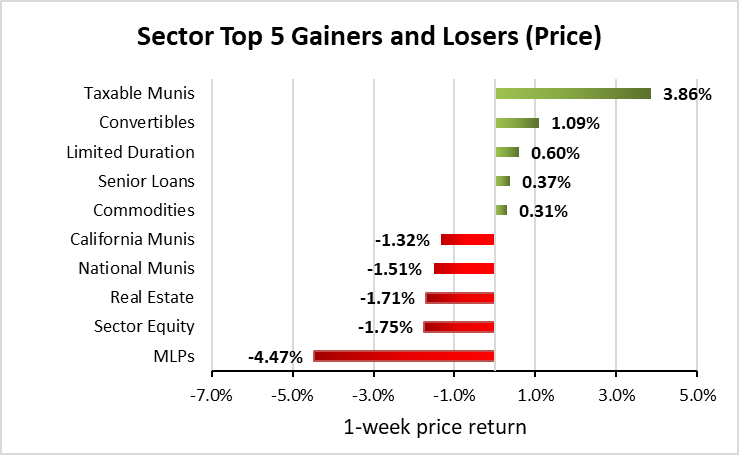
Weekly Closed-End Fund Roundup: August 23, 2020
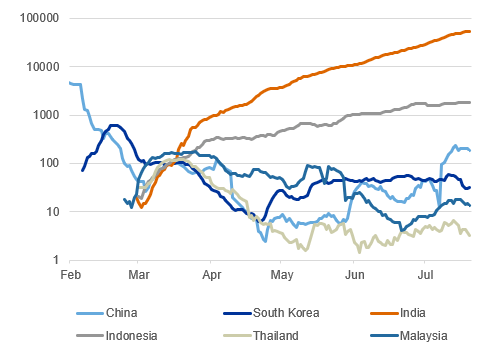
3 Big Challenges For Emerging Markets Amid COVID-19

Terrence Gray and Jian Tao Join Lazard Asset Management
Source: https://incomestatements.info
Category: Stock Reports
