See more : Radico Khaitan Limited (RADICO.BO) Income Statement Analysis – Financial Results
Complete financial analysis of The Central and Eastern Europe Fund, Inc. (CEE) income statement, including revenue, profit margins, EPS and key performance metrics. Get detailed insights into the financial performance of The Central and Eastern Europe Fund, Inc., a leading company in the Asset Management industry within the Financial Services sector.
- Eagle Point Income Company Inc. (EICC) Income Statement Analysis – Financial Results
- Cornerstone Financial Holdings Limited (8112.HK) Income Statement Analysis – Financial Results
- Agra Ventures Ltd. (AGFAF) Income Statement Analysis – Financial Results
- ATOME Energy PLC (ATOM.L) Income Statement Analysis – Financial Results
- Olink Holding AB (publ) (OLK) Income Statement Analysis – Financial Results
The Central and Eastern Europe Fund, Inc. (CEE)
Industry: Asset Management
Sector: Financial Services
Website: https://fundsus.deutscheam.com/EN/products/central-eastern-europe-fund.jsp?core-key=2506#
About The Central and Eastern Europe Fund, Inc.
The Central and Eastern Europe Fund, Inc. is a closed ended equity mutual fund launched by Deutsche Investment Management Americas Inc. The fund is managed by Deutsche Asset Management International GmbH. It invests in the public equity markets across Central and Eastern Europe. The fund seeks to invest in stocks of companies operating across diversified sectors. It benchmarks the performance of its portfolio against the CECE, RTX, and ISE National 30. The fund was formerly known as The Central Europe And Russia Fund, Inc. The Central and Eastern Europe Fund, Inc. was formed on March 6, 1990 and is domiciled in the United States.
| Metric | 2023 | 2022 | 2021 | 2020 | 2019 | 2018 | 2017 | 2016 | 2015 | 2014 | 2013 | 2012 | 2011 |
|---|---|---|---|---|---|---|---|---|---|---|---|---|---|
| Revenue | 18.15M | -175.72M | 91.23M | -53.85M | 38.71M | -164.29K | 43.15M | -20.53M | 6.52M | 8.87M | 13.73M | 15.69M | 0.00 |
| Cost of Revenue | 15.68M | 856.31K | 1.90M | 1.80M | 2.00M | 2.08M | 2.01M | 1.78M | 0.00 | 0.00 | 0.00 | 0.00 | 0.00 |
| Gross Profit | 2.48M | -176.58M | 89.33M | -55.65M | 36.72M | -2.24M | 41.14M | -22.31M | 6.52M | 8.87M | 13.73M | 15.69M | 0.00 |
| Gross Profit Ratio | 13.64% | 100.49% | 97.92% | 103.33% | 94.84% | 1,365.18% | 95.34% | 108.69% | 100.00% | 100.00% | 100.00% | 100.00% | 0.00% |
| Research & Development | 0.00 | 12.20 | 7.90 | -122.24 | 4.33 | -0.16 | 2.11 | -0.40 | 0.00 | 0.00 | 0.00 | 0.00 | 0.00 |
| General & Administrative | 457.37K | 843.28K | 973.85K | 976.07K | 1.13M | 1.17M | 1.22M | 2.19M | 2.74M | 4.29M | 5.29M | 5.56M | 0.00 |
| Selling & Marketing | 0.00 | 0.00 | 0.00 | 0.00 | 0.00 | 0.00 | 0.00 | 0.00 | 46.33K | 52.52K | 58.39K | 73.92K | 0.00 |
| SG&A | 457.37K | 843.28K | 973.85K | 976.07K | 1.13M | 1.17M | 1.22M | -0.40 | 2.79M | 4.34M | 5.35M | 5.64M | 0.00 |
| Other Expenses | 0.00 | -134.88K | 10.46K | 11.11K | 10.36K | 10.22K | 10.88K | 7.76M | 0.00 | 0.00 | 0.00 | 0.00 | 0.00 |
| Operating Expenses | 15.39M | 708.40K | 984.31K | 987.17K | 1.14M | 1.18M | 1.23M | 2.62M | 54.86M | 96.46M | 13.36M | 7.07M | 0.00 |
| Cost & Expenses | 18.15M | 708.40K | 984.31K | 987.17K | 1.14M | 1.18M | 1.23M | -22.31M | 54.86M | 96.46M | 13.36M | 7.07M | 0.00 |
| Interest Income | 0.00 | 0.00 | 0.00 | 0.00 | 0.00 | 0.00 | 0.00 | 0.00 | 0.00 | 0.00 | 0.00 | 0.00 | 0.00 |
| Interest Expense | 0.00 | 0.00 | 0.00 | 0.00 | 0.00 | 0.00 | 0.00 | 0.00 | 0.00 | 0.00 | 0.00 | 0.00 | 0.00 |
| Depreciation & Amortization | 0.00 | -1.91M | -5.78M | -6.65M | -8.94M | -7.08M | -3.96M | -3.40M | -3.73M | -4.53M | -8.38M | -10.05M | 0.00 |
| EBITDA | 17.85M | -176.43M | 0.00 | -54.84M | 0.00 | -1.34M | 0.00 | 4.84M | -52.07M | -92.12M | 18.71M | -1.44M | 0.00 |
| EBITDA Ratio | 98.34% | 100.40% | 98.92% | 101.83% | 97.06% | 815.42% | 97.14% | 140.62% | -798.27% | -1,038.77% | 136.29% | -9.16% | 0.00% |
| Operating Income | 17.85M | -176.43M | 90.25M | -54.84M | 37.58M | -1.34M | 41.92M | 3.40M | 3.73M | 4.53M | 8.38M | 10.05M | 0.00 |
| Operating Income Ratio | 98.34% | 100.40% | 98.92% | 101.83% | 97.06% | 815.42% | 97.14% | -16.57% | 57.26% | 51.05% | 61.05% | 64.06% | 0.00% |
| Total Other Income/Expenses | 14.55K | 0.00 | 0.00 | 0.00 | 0.00 | 2.08M | 0.00 | 4.84M | -52.07M | -92.12M | 18.71M | -1.44M | 0.00 |
| Income Before Tax | 17.87M | -176.43M | 90.25M | -54.84M | 37.58M | -1.34M | 41.92M | 8.24M | -48.33M | -87.59M | 27.09M | 8.61M | 0.00 |
| Income Before Tax Ratio | 98.42% | 100.40% | 98.92% | 101.83% | 97.06% | 815.42% | 97.14% | -40.15% | -741.02% | -987.72% | 197.34% | 54.90% | 0.00% |
| Income Tax Expense | 0.00 | 1.90M | 5.76M | 6.57M | 8.94M | -161.14K | 3.96M | -33.80M | -52.07M | -92.12M | 18.71M | -1.44M | 0.00 |
| Net Income | 17.87M | -176.43M | 90.25M | -54.84M | 37.58M | -1.34M | 41.92M | 8.34M | -48.33M | -87.59M | 27.09M | 8.61M | 0.00 |
| Net Income Ratio | 98.42% | 100.40% | 98.92% | 101.83% | 97.06% | 815.42% | 97.14% | -40.62% | -741.02% | -987.72% | 197.34% | 54.90% | 0.00% |
| EPS | 2.86 | -28.36 | 14.33 | -8.21 | 5.60 | -0.23 | 5.61 | 1.01 | -5.91 | -9.37 | 2.41 | 0.66 | 0.00 |
| EPS Diluted | 2.86 | -28.36 | 14.33 | -8.21 | 5.60 | -0.23 | 5.61 | 7.85M | -5.91 | -9.37 | 2.41 | 0.66 | 0.00 |
| Weighted Avg Shares Out | 6.25M | 6.22M | 6.30M | 6.68M | 6.71M | 5.82M | 7.23M | 8.24M | 8.17M | 9.35M | 11.23M | 13.13M | 13.57M |
| Weighted Avg Shares Out (Dil) | 6.25M | 6.22M | 6.30M | 6.68M | 6.71M | 5.82M | 7.47M | 1.06 | 8.17M | 9.35M | 11.23M | 13.13M | 13.57M |

The Central and Eastern Europe Fund, Inc. and The New Germany Fund, Inc. Announce Results of Each Fund’s Annual Meeting of Stockholders

Alliancebernstein L.P. Grows Stake in Deutsche Bank AG (NYSE:DB)
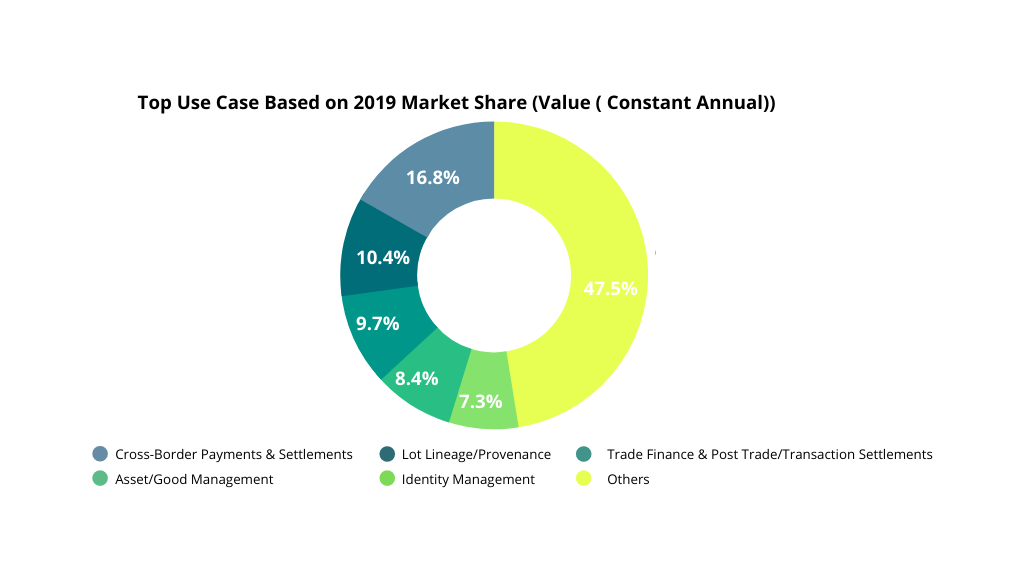
IDC Reports Worldwide Blockchain Spending to Slow Down to US$ 4.3 Billion in 2020 - Fintech Singapore

Janus Henderson Group PLC Decreases Stock Holdings in Deutsche Bank AG (NYSE:DB)

CBD Melbourne: Pyne back in the Canberra picture

'Discourse control': Political leaders' language changes after signing up to Belt and Road, Clive Hamilton says

Denise Krisko, ETF Industry Leader and Legend, Has Passed Away

'It's a dangerous time to go dark': Advertisers prepare for an uncertain summer - Digiday
Source: https://incomestatements.info
Category: Stock Reports

