See more : Catcha Investment Corp. Redeema (CHAA-WT) Income Statement Analysis – Financial Results
Complete financial analysis of Chill Brands Group PLC (CHBRF) income statement, including revenue, profit margins, EPS and key performance metrics. Get detailed insights into the financial performance of Chill Brands Group PLC, a leading company in the Drug Manufacturers – Specialty & Generic industry within the Healthcare sector.
- Stamper Oil & Gas Corp. (STMGF) Income Statement Analysis – Financial Results
- Khgears International Limited (4571.TW) Income Statement Analysis – Financial Results
- Tianjin Teda Co., Ltd. (000652.SZ) Income Statement Analysis – Financial Results
- Co-Tech Development Corporation (8358.TWO) Income Statement Analysis – Financial Results
- Jiangsu Boamax Technologies Group Co., Ltd. (002514.SZ) Income Statement Analysis – Financial Results
Chill Brands Group PLC (CHBRF)
Industry: Drug Manufacturers - Specialty & Generic
Sector: Healthcare
Website: https://chillbrandsgroup.com
About Chill Brands Group PLC
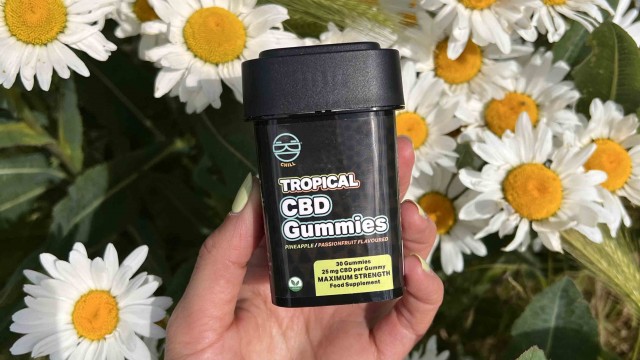
Chill Brands Group PLC engages in the research and development, production, and sale of cannabidiol consumer products and other lifestyle goods in the United States, the United Kingdom, and rest of Europe. The company offers tobacco alternative products, including smokes and chew pouches. It also provides oral tinctures, soft-gel capsules, massage oils, and topical cosmetic products. The company serves its products under the Chill.com and Zoetic brands. The company was formerly known as Zoetic International Plc and changed its name to Chill Brands Group PLC in August 2021. Chill Brands Group PLC was incorporated in 2014 and is headquartered in London, the United Kingdom.
| Metric | 2023 | 2022 | 2021 | 2020 | 2019 | 2018 | 2017 | 2016 |
|---|---|---|---|---|---|---|---|---|
| Revenue | 82.84K | 624.19K | 320.88K | 92.61K | 1.02M | 2.90M | 0.00 | 0.00 |
| Cost of Revenue | 289.70K | 1.40M | 361.52K | 56.68K | 323.84K | 0.00 | 85.75K | 0.00 |
| Gross Profit | -206.86K | -778.81K | -40.64K | 35.92K | 692.56K | 2.90M | -85.75K | 0.00 |
| Gross Profit Ratio | -249.71% | -124.77% | -12.67% | 38.79% | 68.14% | 100.00% | 0.00% | 0.00% |
| Research & Development | 0.00 | 0.00 | 0.00 | 0.00 | 0.00 | 0.00 | 0.00 | 0.00 |
| General & Administrative | 2.64M | 2.84M | 4.66M | 1.88M | 5.51M | 6.88M | 3.37M | 1.82M |
| Selling & Marketing | 0.00 | 0.00 | 0.00 | 0.00 | 0.00 | 0.00 | 0.00 | 0.00 |
| SG&A | 2.64M | 2.84M | 4.66M | 1.88M | 5.51M | 6.88M | 3.37M | 1.82M |
| Other Expenses | 1.27M | 0.00 | 0.00 | 0.00 | 0.00 | 0.00 | 0.00 | 0.00 |
| Operating Expenses | 3.91M | 4.80M | 5.86M | 1.88M | 5.51M | 6.88M | 3.37M | 1.82M |
| Cost & Expenses | 4.20M | 6.20M | 6.22M | 1.94M | 5.51M | 6.88M | 3.37M | 1.82M |
| Interest Income | 24.16K | 1.96K | 1.76K | 1.90K | 473.00 | 1.03K | 477.00 | 1.38K |
| Interest Expense | 323.56K | 0.00 | 0.00 | 0.00 | 0.00 | 0.00 | 0.00 | 0.00 |
| Depreciation & Amortization | 132.78K | 113.22K | 20.68K | 330.32K | 323.84K | 992.27K | 85.75K | 59.92K |
| EBITDA | -3.81M | -5.46M | -4.78M | -2.62M | -310.73K | -2.99M | -3.28M | -1.24M |
| EBITDA Ratio | -4,595.22% | -874.93% | -1,831.90% | -1,639.98% | -284.83% | -102.90% | 0.00% | 0.00% |
| Operating Income | -4.12M | -5.57M | -5.90M | -1.85M | -4.50M | -3.98M | -3.37M | -1.82M |
| Operating Income Ratio | -4,968.20% | -893.05% | -1,838.35% | -1,996.67% | -442.25% | -137.11% | 0.00% | 0.00% |
| Total Other Income/Expenses | -147.36K | 1.96K | 1.76K | 1.10M | 473.00 | 1.03K | 477.00 | 1.38K |
| Income Before Tax | -4.26M | -5.57M | -5.90M | -1.85M | -5.77M | -3.98M | -3.37M | -1.82M |
| Income Before Tax Ratio | -5,146.08% | -892.73% | -1,837.80% | -1,994.61% | -567.76% | -137.07% | 0.00% | 0.00% |
| Income Tax Expense | 0.00 | 139.18K | 49.76K | 5.23M | 1.28M | 0.00 | 0.00 | 0.00 |
| Net Income | -4.29M | -5.71M | -5.95M | -7.08M | -5.77M | -3.98M | -3.37M | -1.82M |
| Net Income Ratio | -5,176.11% | -915.03% | -1,853.31% | -7,643.69% | -567.76% | -137.07% | 0.00% | 0.00% |
| EPS | -0.02 | -0.03 | -0.03 | -0.05 | -0.05 | -0.04 | -0.07 | -0.11 |
| EPS Diluted | -0.02 | -0.03 | -0.03 | -0.05 | -0.05 | -0.04 | -0.07 | -0.11 |
| Weighted Avg Shares Out | 244.41M | 210.48M | 193.39M | 145.41M | 118.25M | 95.81M | 50.39M | 16.69M |
| Weighted Avg Shares Out (Dil) | 242.98M | 210.48M | 193.39M | 145.41M | 118.25M | 95.81M | 50.39M | 16.69M |

Chill Brands on disposable vape ban and post-disposable vaping landscape - ICYMI

Chill Brands adapts to UK's proposed vaping rule with innovative product development - ICYMI

Chill Brands comments on UK disposable vape ban

Chill Brands secures £2.4mln in new equity funding round

Independent vape stores are on the rise- experts weigh in

Chill Brands plots course for major product launches and regulatory initiatives

Chill Brands expecting material jump in revenue after store deals

Interview with Chill Brands CEO Callum Sommerton on strategic growth and 2024 - ICYMI

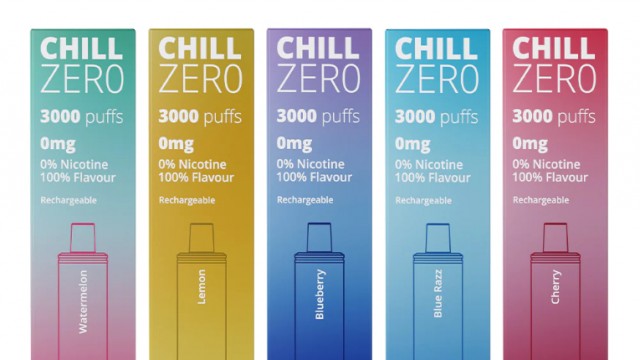
Chill Brands' Chill ZERO vapes heading to Shell, BP and Esso stores

Chill Brands Group rounds out year of change with fresh Chill ZERO supply deal
Source: https://incomestatements.info
Category: Stock Reports
