See more : Bone Biologics Corporation (BBLGW) Income Statement Analysis – Financial Results
Complete financial analysis of Chill Brands Group PLC (CHBRF) income statement, including revenue, profit margins, EPS and key performance metrics. Get detailed insights into the financial performance of Chill Brands Group PLC, a leading company in the Drug Manufacturers – Specialty & Generic industry within the Healthcare sector.
- Manulife US Real Estate Investment Trust (BTOU.SI) Income Statement Analysis – Financial Results
- Cincinnati Financial Corporation (0HYE.L) Income Statement Analysis – Financial Results
- WONIK Materials Co.,Ltd. (104830.KQ) Income Statement Analysis – Financial Results
- Zoono Group Limited (ZOONF) Income Statement Analysis – Financial Results
- Syscom Computer Engineering Co. (2453.TW) Income Statement Analysis – Financial Results
Chill Brands Group PLC (CHBRF)
Industry: Drug Manufacturers - Specialty & Generic
Sector: Healthcare
Website: https://chillbrandsgroup.com
About Chill Brands Group PLC
Chill Brands Group PLC engages in the research and development, production, and sale of cannabidiol consumer products and other lifestyle goods in the United States, the United Kingdom, and rest of Europe. The company offers tobacco alternative products, including smokes and chew pouches. It also provides oral tinctures, soft-gel capsules, massage oils, and topical cosmetic products. The company serves its products under the Chill.com and Zoetic brands. The company was formerly known as Zoetic International Plc and changed its name to Chill Brands Group PLC in August 2021. Chill Brands Group PLC was incorporated in 2014 and is headquartered in London, the United Kingdom.
| Metric | 2023 | 2022 | 2021 | 2020 | 2019 | 2018 | 2017 | 2016 |
|---|---|---|---|---|---|---|---|---|
| Revenue | 82.84K | 624.19K | 320.88K | 92.61K | 1.02M | 2.90M | 0.00 | 0.00 |
| Cost of Revenue | 289.70K | 1.40M | 361.52K | 56.68K | 323.84K | 0.00 | 85.75K | 0.00 |
| Gross Profit | -206.86K | -778.81K | -40.64K | 35.92K | 692.56K | 2.90M | -85.75K | 0.00 |
| Gross Profit Ratio | -249.71% | -124.77% | -12.67% | 38.79% | 68.14% | 100.00% | 0.00% | 0.00% |
| Research & Development | 0.00 | 0.00 | 0.00 | 0.00 | 0.00 | 0.00 | 0.00 | 0.00 |
| General & Administrative | 2.64M | 2.84M | 4.66M | 1.88M | 5.51M | 6.88M | 3.37M | 1.82M |
| Selling & Marketing | 0.00 | 0.00 | 0.00 | 0.00 | 0.00 | 0.00 | 0.00 | 0.00 |
| SG&A | 2.64M | 2.84M | 4.66M | 1.88M | 5.51M | 6.88M | 3.37M | 1.82M |
| Other Expenses | 1.27M | 0.00 | 0.00 | 0.00 | 0.00 | 0.00 | 0.00 | 0.00 |
| Operating Expenses | 3.91M | 4.80M | 5.86M | 1.88M | 5.51M | 6.88M | 3.37M | 1.82M |
| Cost & Expenses | 4.20M | 6.20M | 6.22M | 1.94M | 5.51M | 6.88M | 3.37M | 1.82M |
| Interest Income | 24.16K | 1.96K | 1.76K | 1.90K | 473.00 | 1.03K | 477.00 | 1.38K |
| Interest Expense | 323.56K | 0.00 | 0.00 | 0.00 | 0.00 | 0.00 | 0.00 | 0.00 |
| Depreciation & Amortization | 132.78K | 113.22K | 20.68K | 330.32K | 323.84K | 992.27K | 85.75K | 59.92K |
| EBITDA | -3.81M | -5.46M | -4.78M | -2.62M | -310.73K | -2.99M | -3.28M | -1.24M |
| EBITDA Ratio | -4,595.22% | -874.93% | -1,831.90% | -1,639.98% | -284.83% | -102.90% | 0.00% | 0.00% |
| Operating Income | -4.12M | -5.57M | -5.90M | -1.85M | -4.50M | -3.98M | -3.37M | -1.82M |
| Operating Income Ratio | -4,968.20% | -893.05% | -1,838.35% | -1,996.67% | -442.25% | -137.11% | 0.00% | 0.00% |
| Total Other Income/Expenses | -147.36K | 1.96K | 1.76K | 1.10M | 473.00 | 1.03K | 477.00 | 1.38K |
| Income Before Tax | -4.26M | -5.57M | -5.90M | -1.85M | -5.77M | -3.98M | -3.37M | -1.82M |
| Income Before Tax Ratio | -5,146.08% | -892.73% | -1,837.80% | -1,994.61% | -567.76% | -137.07% | 0.00% | 0.00% |
| Income Tax Expense | 0.00 | 139.18K | 49.76K | 5.23M | 1.28M | 0.00 | 0.00 | 0.00 |
| Net Income | -4.29M | -5.71M | -5.95M | -7.08M | -5.77M | -3.98M | -3.37M | -1.82M |
| Net Income Ratio | -5,176.11% | -915.03% | -1,853.31% | -7,643.69% | -567.76% | -137.07% | 0.00% | 0.00% |
| EPS | -0.02 | -0.03 | -0.03 | -0.05 | -0.05 | -0.04 | -0.07 | -0.11 |
| EPS Diluted | -0.02 | -0.03 | -0.03 | -0.05 | -0.05 | -0.04 | -0.07 | -0.11 |
| Weighted Avg Shares Out | 244.41M | 210.48M | 193.39M | 145.41M | 118.25M | 95.81M | 50.39M | 16.69M |
| Weighted Avg Shares Out (Dil) | 242.98M | 210.48M | 193.39M | 145.41M | 118.25M | 95.81M | 50.39M | 16.69M |

Chill Brands up on deal with top five supermarket

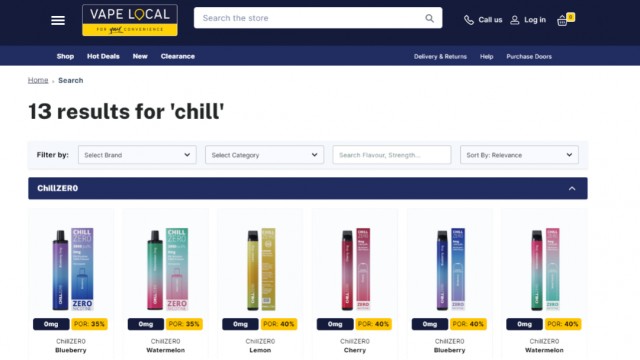
Chill Brands' Chill ZERO vapes coming to a top-five supermarket chain in 2024

Chill Brands' nicotine-free vapes increase market presence in UK and US

Chill Brands' Chill ZERO range picked up by Flawless Vape Shop

Chill Brands nicotine-free products listed with leading UK vaping wholesaler

Chill Brands boss likens nicotine vapes to non-alcoholic beer
Source: https://incomestatements.info
Category: Stock Reports
