See more : Tharisa plc (THA.JO) Income Statement Analysis – Financial Results
Complete financial analysis of Clean Seed Capital Group Ltd. (CLGPF) income statement, including revenue, profit margins, EPS and key performance metrics. Get detailed insights into the financial performance of Clean Seed Capital Group Ltd., a leading company in the Agricultural – Machinery industry within the Industrials sector.
- Savezone I&C Corporation (067830.KS) Income Statement Analysis – Financial Results
- K3 Business Technology Group plc (KBT.L) Income Statement Analysis – Financial Results
- Bros Eastern.,Ltd (601339.SS) Income Statement Analysis – Financial Results
- Fujian Yongan Forestry(Group)Joint -Stock Co.,Ltd. (000663.SZ) Income Statement Analysis – Financial Results
- Shivalik Rasayan Limited (SHIVALIK.BO) Income Statement Analysis – Financial Results
Clean Seed Capital Group Ltd. (CLGPF)
About Clean Seed Capital Group Ltd.
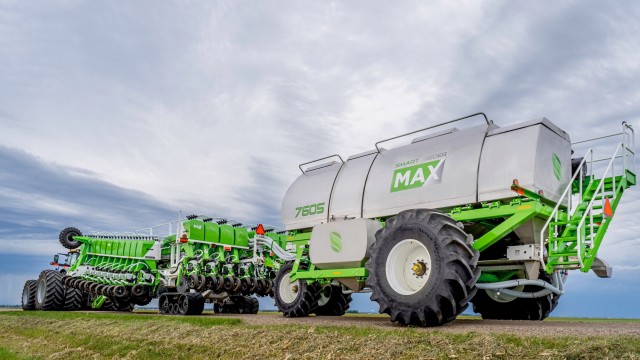
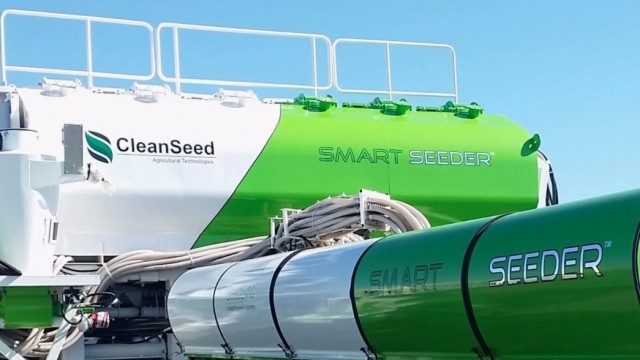
Clean Seed Capital Group Ltd., together with its subsidiaries, operates in the agriculture equipment industry in North America. It offers seeding and planting equipment. The company focuses on the development of the SMART Seeder MAX-S prototype and commercialization of the related SMART Seeder technology. It is also involved in the software development business. Clean Seed Capital Group Ltd. was incorporated in 2010 and is headquartered in Burnaby, Canada.
| Metric | 2023 | 2022 | 2021 | 2020 | 2019 | 2018 | 2017 | 2016 | 2015 | 2014 | 2013 | 2012 | 2011 |
|---|---|---|---|---|---|---|---|---|---|---|---|---|---|
| Revenue | 0.00 | 1.27M | 7.39K | 5.20M | 0.00 | 0.00 | 0.00 | 1.05M | 0.00 | 0.00 | 0.00 | 0.00 | 0.00 |
| Cost of Revenue | 0.00 | 0.00 | 0.00 | 0.00 | 736.86K | 622.72K | 536.41K | 860.79K | 0.00 | 0.00 | 0.00 | 0.00 | 0.00 |
| Gross Profit | 0.00 | 1.27M | 7.39K | 5.20M | -736.86K | -622.72K | -536.41K | 189.21K | 0.00 | 0.00 | 0.00 | 0.00 | 0.00 |
| Gross Profit Ratio | 0.00% | 100.00% | 100.00% | 100.00% | 0.00% | 0.00% | 0.00% | 18.02% | 0.00% | 0.00% | 0.00% | 0.00% | 0.00% |
| Research & Development | 852.50K | 301.84K | 77.79K | -3.83K | 599.24K | 2.56M | 56.10K | 0.00 | 0.00 | 12.36K | 125.89K | 65.46K | 0.00 |
| General & Administrative | 629.23K | 1.67M | 1.78M | 1.52M | 1.80M | 2.63M | 1.18M | 1.27M | 1.14M | 1.17M | 851.57K | 1.20M | 204.22K |
| Selling & Marketing | 1.13M | 0.00 | 0.00 | 0.00 | 0.00 | 0.00 | 0.00 | 0.00 | 0.00 | 0.00 | 0.00 | 0.00 | 0.00 |
| SG&A | 1.75M | 1.67M | 1.78M | 1.52M | 1.80M | 2.63M | 1.18M | 1.27M | 1.14M | 1.17M | 851.57K | 1.20M | 204.22K |
| Other Expenses | 0.00 | 0.00 | 0.00 | 0.00 | 0.00 | 0.00 | 0.00 | 0.00 | 0.00 | 0.00 | 0.00 | 0.00 | 0.00 |
| Operating Expenses | 2.61M | 3.14M | 2.88M | 2.52M | 3.39M | 5.98M | 1.89M | 1.37M | 1.17M | 1.20M | 991.69K | 1.28M | 208.69K |
| Cost & Expenses | 2.61M | 3.14M | 2.88M | 2.52M | 3.39M | 5.98M | 1.89M | 2.23M | 1.17M | 1.20M | 991.69K | 1.28M | 208.69K |
| Interest Income | 0.00 | 0.00 | 0.00 | 0.00 | 0.00 | 0.00 | 0.00 | 0.00 | 0.00 | 0.00 | 0.00 | 0.00 | 0.00 |
| Interest Expense | 0.00 | 360.49K | 225.83K | 438.24K | 383.44K | 226.58K | 56.64K | 14.30K | 29.38K | 39.53K | 32.34K | 29.49K | 0.00 |
| Depreciation & Amortization | 979.34K | 1.04M | 940.16K | 953.74K | 736.86K | 622.72K | 536.41K | 90.73K | 29.44K | 21.95K | 14.23K | 12.79K | 4.47K |
| EBITDA | -2.87M | -1.24M | -2.11M | 3.64M | -2.61M | -5.29M | -1.35M | -1.11M | -1.14M | -1.18M | -977.46K | -1.27M | -204.22K |
| EBITDA Ratio | 0.00% | -95.04% | -27,362.55% | 69.97% | 0.00% | 0.00% | 0.00% | -103.37% | 0.00% | 0.00% | 0.00% | 0.00% | 0.00% |
| Operating Income | -2.61M | -2.24M | -2.96M | 2.69M | -3.39M | -5.98M | -3.61M | -1.21M | -1.25M | -1.25M | -1.03M | -1.30M | -208.69K |
| Operating Income Ratio | 0.00% | -177.33% | -40,082.94% | 51.64% | 0.00% | 0.00% | 0.00% | -115.47% | 0.00% | 0.00% | 0.00% | 0.00% | 0.00% |
| Total Other Income/Expenses | -2.27M | -1.81M | -393.64K | -1.54M | -571.26K | -849.30K | 1.66M | -127.06K | 0.00 | -66.08K | 0.00 | 0.00 | 0.00 |
| Income Before Tax | -4.88M | -2.64M | -3.27M | 2.09M | -3.77M | -6.20M | -1.94M | -1.21M | -1.25M | -1.25M | -1.03M | -1.30M | -208.69K |
| Income Before Tax Ratio | 0.00% | -208.50% | -44,257.12% | 40.19% | 0.00% | 0.00% | 0.00% | -115.47% | 0.00% | 0.00% | 0.00% | 0.00% | 0.00% |
| Income Tax Expense | 0.00 | -9.94K | 140.70K | 438.24K | 565.00K | 0.00 | 1.72M | 14.30K | 29.38K | 39.53K | 32.34K | 29.49K | 0.00 |
| Net Income | -4.88M | -2.64M | -3.27M | 2.09M | -3.77M | -6.20M | -1.94M | -1.21M | -1.25M | -1.25M | -1.03M | -1.30M | -208.69K |
| Net Income Ratio | 0.00% | -208.50% | -44,257.12% | 40.19% | 0.00% | 0.00% | 0.00% | -115.47% | 0.00% | 0.00% | 0.00% | 0.00% | 0.00% |
| EPS | -0.05 | -0.03 | -0.04 | 0.03 | -0.06 | -0.12 | -0.04 | -0.03 | -0.04 | -0.04 | -0.04 | -0.07 | -0.05 |
| EPS Diluted | -0.05 | -0.03 | -0.04 | 0.03 | -0.06 | -0.12 | -0.04 | -0.03 | -0.04 | -0.04 | -0.04 | -0.07 | -0.05 |
| Weighted Avg Shares Out | 90.10M | 82.88M | 77.06M | 66.79M | 58.22M | 52.44M | 45.38M | 41.77M | 34.72M | 28.34M | 23.17M | 17.49M | 4.55M |
| Weighted Avg Shares Out (Dil) | 90.10M | 82.88M | 77.06M | 66.79M | 58.22M | 52.44M | 45.38M | 41.77M | 34.72M | 28.34M | 23.17M | 17.49M | 4.55M |

Clean Seed Capital welcomes Indian ministerial delegation to its agricultural technology facilities in Saskatoon

Clean Seed Capital updates on recent activity, including introduction of the Mini-MAX in India

Clean Seed Capital set to demonstrate its SMART Seeder MAX technology in Saskatchewan

Clean Seed Capital receives orders for its SMART Seeder MAX from Saskatchewan's Canada West Harvest Centre

Clean Seed Capital gets set for busy spring season as it positions itself to capitalize on demand for sustainable agriculture

Clean Seed Capital set to introduce Mini-MAX unit to India in March this year

Clean Seed Capital announces stock now trading on OTCQB Venture Market

Clean Seed Capital poised to step out internationally with its agricultural technology, says boss

Clean Seed Capital Group is gearing up for rapid growth with its agricultural technology

Clean Seed Capital welcomes mention by Lieutenant Governor of Saskatchewan in his throne speech
Source: https://incomestatements.info
Category: Stock Reports
