See more : GS Global Corp. (001250.KS) Income Statement Analysis – Financial Results
Complete financial analysis of Cornerstone Strategic Value Fund, Inc. (CLM) income statement, including revenue, profit margins, EPS and key performance metrics. Get detailed insights into the financial performance of Cornerstone Strategic Value Fund, Inc., a leading company in the Asset Management industry within the Financial Services sector.
- The Hi-Tech Gears Limited (HITECHGEAR.BO) Income Statement Analysis – Financial Results
- ASPEED Technology Inc. (5274.TWO) Income Statement Analysis – Financial Results
- Hitachi Energy India Limited (POWERINDIA.BO) Income Statement Analysis – Financial Results
- Barry Callebaut AG (BRRLY) Income Statement Analysis – Financial Results
- Kingsland Global Ltd. (KLO.AX) Income Statement Analysis – Financial Results
Cornerstone Strategic Value Fund, Inc. (CLM)
Industry: Asset Management
Sector: Financial Services
About Cornerstone Strategic Value Fund, Inc.
Cornerstone Strategic Value Fund, Inc. is a closed-ended equity mutual fund launched and managed by Cornerstone Advisors, Inc. The fund invests in public equity markets across the globe. It seeks to invest in stocks of companies operating across diversified sectors. The fund primarily invests in value and growth stocks of companies. It also invests through other closed-end investment companies and ETF's. Cornerstone Strategic Value Fund, Inc. was formed on May 1, 1987 and is domiciled in the United States.
| Metric | 2023 | 2022 | 2021 | 2020 | 2019 | 2018 | 2017 | 2016 | 2015 | 2014 | 2013 | 2012 | 2011 | 2010 |
|---|---|---|---|---|---|---|---|---|---|---|---|---|---|---|
| Revenue | 394.84M | -249.16M | 204.38M | 104.37M | 204.16M | -57.16M | 99.93M | 32.26M | -22.06M | 20.07M | 21.88M | 12.02M | 1.47M | 6.16M |
| Cost of Revenue | 268.36M | 13.99M | 11.10M | 7.92M | 8.60M | 7.67M | 4.64M | 3.26M | 2.65M | 0.00 | 0.00 | 0.00 | 0.00 | 0.00 |
| Gross Profit | 126.47M | -263.15M | 193.28M | 96.45M | 195.56M | -64.83M | 95.29M | 29.00M | -24.71M | 20.07M | 21.88M | 12.02M | 1.47M | 6.16M |
| Gross Profit Ratio | 32.03% | 105.61% | 94.57% | 92.41% | 95.79% | 113.41% | 95.36% | 89.91% | 112.03% | 100.00% | 100.00% | 100.00% | 100.00% | 100.00% |
| Research & Development | 0.00 | -4.75 | 1.89 | 1.46 | 3.63 | 0.00 | 0.00 | 0.00 | 0.00 | 0.00 | 0.00 | 0.00 | 0.00 | 0.00 |
| General & Administrative | 1.54M | 1.37M | 1.17M | 995.29K | 1.12M | 980.91K | 851.14K | 740.21K | 541.86K | 555.86K | 345.49K | 332.07K | 312.51K | 370.30K |
| Selling & Marketing | 0.00 | 0.00 | 0.00 | 0.00 | 0.00 | 0.00 | 0.00 | 0.00 | 0.00 | 0.00 | 0.00 | 0.00 | 0.00 | 0.00 |
| SG&A | 1.54M | 1.37M | 1.17M | 995.29K | 1.12M | 980.91K | 851.14K | 740.21K | 541.86K | 555.86K | 345.49K | 332.07K | 312.51K | 370.30K |
| Other Expenses | 0.00 | 40.44K | 40.14K | 35.23K | -95.99K | 38.35K | 34.80K | 37.60K | 33.44K | 24.85K | 21.92K | 21.14K | 18.43K | 16.81K |
| Operating Expenses | 394.84M | 1.41M | 1.21M | 1.03M | 1.02M | 1.02M | 885.94K | 777.80K | 575.30K | 580.70K | 367.41K | 353.21K | 330.94K | 387.11K |
| Cost & Expenses | 394.84M | 1.41M | 1.21M | 1.03M | 1.02M | 1.02M | 885.94K | 777.80K | 575.30K | 580.70K | 367.41K | 353.21K | 330.94K | 387.11K |
| Interest Income | 0.00 | 0.00 | 0.00 | 0.00 | 0.00 | 0.00 | 0.00 | 0.00 | 0.00 | 0.00 | 0.00 | 0.00 | 0.00 | 0.00 |
| Interest Expense | 0.00 | 0.00 | 0.00 | 0.00 | 0.00 | 0.00 | 0.00 | 0.00 | 0.00 | 0.00 | 0.00 | 0.00 | 0.00 | 0.00 |
| Depreciation & Amortization | 0.00 | 228.49K | 236.56K | 206.30K | 171.86K | 161.14K | 52.52K | 22.82K | 0.00 | 0.00 | 0.00 | 0.00 | 0.00 | 0.00 |
| EBITDA | 393.25M | -250.57M | 203.17M | 103.34M | 203.14M | -58.18M | 99.04M | 31.48M | -22.85M | 19.49M | 21.51M | 11.67M | 1.14M | 5.78M |
| EBITDA Ratio | 99.60% | 100.57% | 99.41% | 99.01% | 99.50% | 101.78% | 99.11% | 97.59% | 103.61% | 97.11% | 98.32% | 97.06% | 77.54% | 93.72% |
| Operating Income | 393.25M | -250.57M | 203.17M | 103.34M | 203.14M | -58.18M | 99.04M | 31.48M | -22.85M | 19.49M | 21.51M | 11.67M | 1.14M | 5.78M |
| Operating Income Ratio | 99.60% | 100.57% | 99.41% | 99.01% | 99.50% | 101.78% | 99.11% | 97.59% | 103.61% | 97.11% | 98.32% | 97.06% | 77.54% | 93.72% |
| Total Other Income/Expenses | 0.00 | 0.00 | 0.00 | 0.00 | 0.00 | 0.00 | 0.00 | 0.00 | 0.00 | 0.00 | 0.00 | 0.00 | 0.00 | 0.00 |
| Income Before Tax | 393.25M | -250.57M | 203.17M | 103.34M | 203.14M | -58.18M | 99.04M | 31.48M | -22.85M | 19.49M | 21.51M | 11.67M | 1.14M | 5.78M |
| Income Before Tax Ratio | 99.60% | 100.57% | 99.41% | 99.01% | 99.50% | 101.78% | 99.11% | 97.59% | 103.61% | 97.11% | 98.32% | 97.06% | 77.54% | 93.72% |
| Income Tax Expense | 0.00 | -228.48K | -236.56K | -206.30K | -171.85K | -161.15K | -52.52K | -22.81K | 0.00 | 0.00 | 0.00 | 0.00 | 0.00 | 0.00 |
| Net Income | 393.25M | -250.57M | 203.17M | 103.34M | 203.14M | -58.18M | 99.04M | 31.48M | -22.85M | 19.49M | 21.51M | 11.67M | 1.14M | 5.78M |
| Net Income Ratio | 99.60% | 100.57% | 99.41% | 99.01% | 99.50% | 101.78% | 99.11% | 97.59% | 103.61% | 97.11% | 98.32% | 97.06% | 77.54% | 93.72% |
| EPS | 1.77 | -1.16 | 1.87 | 1.36 | 2.76 | -0.74 | 2.80 | 1.21 | -0.99 | 2.37 | 4.11 | 3.13 | 0.31 | 2.65 |
| EPS Diluted | 1.77 | -1.16 | 1.87 | 1.36 | 2.76 | -0.74 | 2.80 | 1.21 | -0.99 | 2.37 | 4.11 | 3.13 | 0.31 | 2.65 |
| Weighted Avg Shares Out | 222.17M | 216.01M | 108.65M | 75.99M | 73.60M | 78.62M | 35.37M | 25.97M | 23.14M | 8.24M | 8.12M | 3.73M | 3.67M | 2.18M |
| Weighted Avg Shares Out (Dil) | 222.17M | 216.01M | 108.65M | 75.99M | 73.60M | 78.62M | 35.37M | 25.97M | 23.14M | 8.24M | 8.12M | 3.73M | 3.67M | 2.18M |
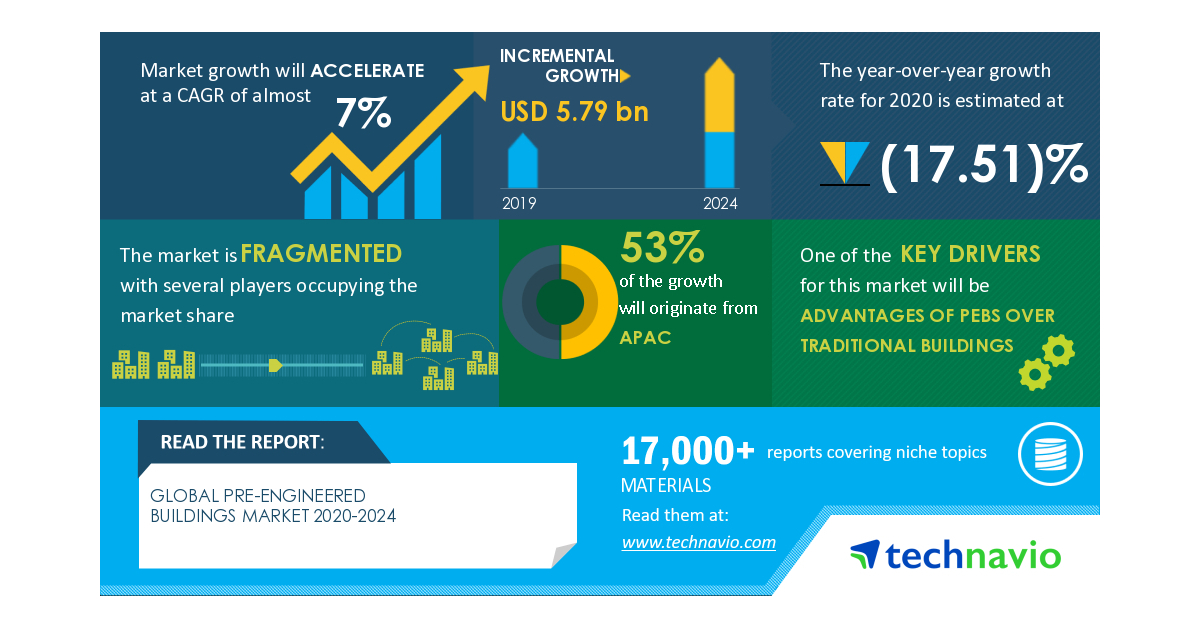
Pre-engineered Buildings Market - Actionable Research on COVID-19 | Advantages of PEBs Over Traditional Buildings to Boost the Market Growth | Technavio

Resignation of mining CEO after destruction of Aboriginal caves represents a tectonic shift in social investing

Fed makes its last stand in struggle to keep potent in age of low interest rates

Is Tech Correction A Head Fake Or Bursting Bubble?
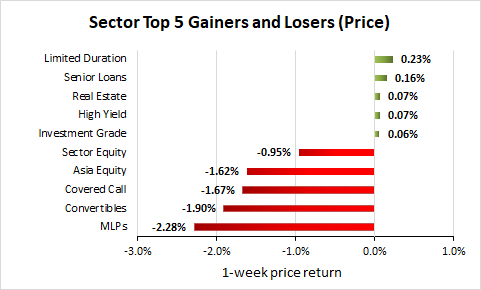
Weekly Closed-End Fund Roundup: September 6, 2020
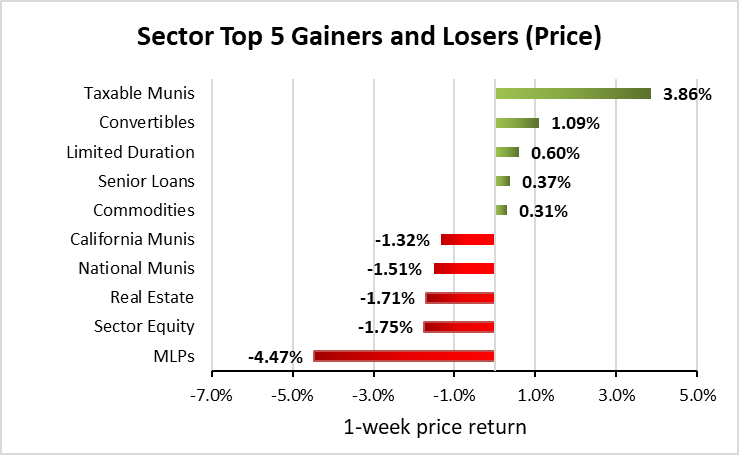
Weekly Closed-End Fund Roundup: August 23, 2020

Cornerstone Solutions Congratulates Winning Campaigns in the 2020 Primary Election

Will The Fed Unveil A New Monetary Policy Today?

Powell in Jackson Hole speech will put out Fed’s welcome mat for hot labor markets and inflation overshoots

Home Depot Inc (NYSE:HD) Shares Bought by Cornerstone Advisors Inc.
Source: https://incomestatements.info
Category: Stock Reports
