Complete financial analysis of Colony Credit Real Estate, Inc. (CLNC) income statement, including revenue, profit margins, EPS and key performance metrics. Get detailed insights into the financial performance of Colony Credit Real Estate, Inc., a leading company in the REIT – Diversified industry within the Real Estate sector.
- Redbubble Limited (RBL.AX) Income Statement Analysis – Financial Results
- By-health Co., Ltd. (300146.SZ) Income Statement Analysis – Financial Results
- DEAG Deutsche Entertainment Aktiengesellschaft (LOUD.DE) Income Statement Analysis – Financial Results
- Nippon Pallet Pool Co., Ltd. (4690.T) Income Statement Analysis – Financial Results
- Moong Pattana International Public Company Limited (MOONG.BK) Income Statement Analysis – Financial Results
Colony Credit Real Estate, Inc. (CLNC)
About Colony Credit Real Estate, Inc.
Colony Credit Real Estate, Inc. operates as a real estate investment trust. The company is headquartered in Los Angeles, California. The company is focused on originating and acquiring a diversified portfolio of CRE debt and net lease real estate investments. Its diversified portfolio consists of senior mortgage loans, mezzanine loans, preferred equity, CRE debt securities and net leased properties. The company operates through four segments: Commercial Real Estate Debt, which is focused on originating, acquiring and asset managing CRE debt investments, including mortgage loans, subordinate interests and mezzanine loans, as well as preferred equity interests; Commercial Real Estate Equity, which is focused on the ownership in real estate and real estate assets, and Commercial Real Estate Securities, which is focused on investing in commercial mortgage-backed securities, unsecured REIT debt, collateralized debt obligation (CDO) notes and other securities.
| Metric | 2020 | 2019 | 2018 | 2017 | 2016 | 2015 |
|---|---|---|---|---|---|---|
| Revenue | 424.35M | 549.33M | 473.36M | 163.96M | 141.67M | 112.71M |
| Cost of Revenue | 211.98M | 310.50M | 253.10M | 29.00M | 26.94M | 1.99M |
| Gross Profit | 212.37M | 238.83M | 220.26M | 134.97M | 114.73M | 110.73M |
| Gross Profit Ratio | 50.05% | 43.48% | 46.53% | 82.32% | 80.99% | 98.24% |
| Research & Development | 0.00 | 0.00 | 0.00 | 0.00 | 0.00 | 0.00 |
| General & Administrative | 66.27M | 81.52M | 106.62M | 15.24M | 17.20M | 15.32M |
| Selling & Marketing | 0.00 | 0.00 | 0.00 | 0.00 | 0.00 | 0.00 |
| SG&A | 66.27M | 81.52M | 106.62M | 15.24M | 17.20M | 15.32M |
| Other Expenses | 136.49M | 321.46M | 201.25M | 8.86M | 3.00M | 721.00K |
| Operating Expenses | 202.76M | 402.98M | 307.87M | 24.10M | 20.20M | 16.04M |
| Cost & Expenses | 414.74M | 713.47M | 560.97M | 53.10M | 47.14M | 18.02M |
| Interest Income | 0.00 | 0.00 | 0.00 | 0.00 | 0.00 | 0.00 |
| Interest Expense | 48.86M | 55.42M | 43.44M | 5.10M | 0.00 | 18.95M |
| Depreciation & Amortization | 59.85M | 103.32M | 90.99M | 9.14M | 146.00K | 5.06M |
| EBITDA | -255.49M | -252.60M | 2.98M | 104.94M | 77.72M | 99.75M |
| EBITDA Ratio | -60.21% | -45.98% | 0.63% | 64.00% | 54.86% | 88.50% |
| Operating Income | 9.61M | -164.14M | -87.61M | 110.86M | 94.53M | 94.69M |
| Operating Income Ratio | 2.26% | -29.88% | -18.51% | 67.61% | 66.73% | 84.01% |
| Total Other Income/Expenses | -260.92M | -332.27M | -76.46M | -5.49M | -56.00K | -12.83M |
| Income Before Tax | -251.31M | -496.42M | -164.07M | 105.38M | 94.48M | 81.86M |
| Income Before Tax Ratio | -59.22% | -90.37% | -34.66% | 64.27% | 66.69% | 72.62% |
| Income Tax Expense | -10.90M | 3.17M | 37.06M | 2.21M | 1.52M | 247.00K |
| Net Income | -353.30M | -414.51M | -168.50M | 88.50M | 76.05M | 80.55M |
| Net Income Ratio | -83.26% | -75.46% | -35.60% | 53.98% | 53.68% | 71.47% |
| EPS | -2.75 | -3.23 | -1.40 | 0.69 | 0.59 | 0.63 |
| EPS Diluted | -2.75 | -3.23 | -1.40 | 0.69 | 0.59 | 0.63 |
| Weighted Avg Shares Out | 128.55M | 128.39M | 120.68M | 127.89M | 127.89M | 127.89M |
| Weighted Avg Shares Out (Dil) | 128.55M | 128.39M | 120.68M | 127.89M | 127.89M | 127.89M |

BrightSpire Capital Announces $0.20 Per Share Dividend for Third Quarter 2022

BrightSpire Capital Announces $0.20 Per Share Dividend for Second Quarter 2022

BrightSpire Capital Announces $0.19 Per Share Dividend for First Quarter 2022

Wall Street Analysts Predict a 25% Upside in Colony Credit (BRSP): Here's What You Should Know

BrightSpire Capital, Inc. (Formerly Colony Credit Real Estate) Announces Sale of Portfolio of Development and Non-Accrual Investments for $223 Million

BrightSpire Capital, Inc. (Formerly Colony Credit Real Estate) Announces Sale of Portfolio of Development and Non-Accrual Investments for $223 Million

BrightSpire Capital, Inc. Completes Name Change from Colony Credit Real Estate, Inc.

BrightSpire Capital, Inc. Completes Name Change from Colony Credit Real Estate, Inc.

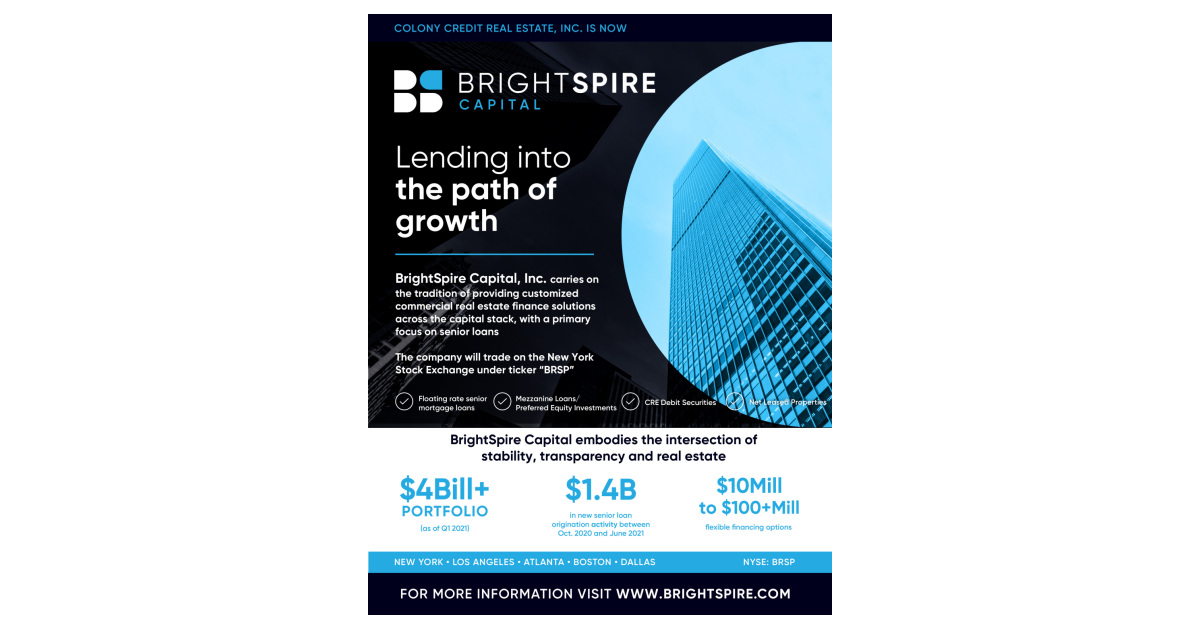
Colony Credit Real Estate, Inc. Announces Rebrand and Name Change to BrightSpire Capital, Inc.

Colony Credit Real Estate, Inc. Announces Rebrand and Name Change to BrightSpire Capital, Inc.
Source: https://incomestatements.info
Category: Stock Reports
