See more : Takasho Co.,Ltd. (7590.T) Income Statement Analysis – Financial Results
Complete financial analysis of Calyxt, Inc. (CLXT) income statement, including revenue, profit margins, EPS and key performance metrics. Get detailed insights into the financial performance of Calyxt, Inc., a leading company in the Packaged Foods industry within the Consumer Defensive sector.
- Cinerad Communications Limited (CINERAD.BO) Income Statement Analysis – Financial Results
- HKS Co., Ltd. (7219.T) Income Statement Analysis – Financial Results
- Comtech Telecommunications Corp. (CMTL) Income Statement Analysis – Financial Results
- Ambuja Cements Limited (AMBUJACEM.BO) Income Statement Analysis – Financial Results
- Provident Financial Holdings, Inc. (PROV) Income Statement Analysis – Financial Results
Calyxt, Inc. (CLXT)
About Calyxt, Inc.
Calyxt, Inc., a synthetic biology company, engages in delivering plant-based solutions primarily to the agriculture end market in the United States. The company is involved in the development of improved digestibility alfalfa; hemp; and wheat with a higher fiber content. It has a commercialization agreement with S&W Seed Company for the exclusive license of an improved quality alfalfa seed in the United States and internationally. The company was formerly known as Cellectis Plant Sciences, Inc. and changed its name to Calyxt, Inc. in May 2015. Calyxt, Inc. was incorporated in 2010 and is headquartered in Roseville, Minnesota. Calyxt, Inc. is a subsidiary of Cellectis S.A.
| Metric | 2022 | 2021 | 2020 | 2019 | 2018 | 2017 | 2016 | 2015 |
|---|---|---|---|---|---|---|---|---|
| Revenue | 157.00K | 25.99M | 23.85M | 7.30M | 236.00K | 508.00K | 399.00K | 1.27M |
| Cost of Revenue | 0.00 | 28.56M | 35.13M | 9.28M | 0.00 | 0.00 | 200.00K | 751.00K |
| Gross Profit | 157.00K | -2.57M | -11.28M | -1.98M | 236.00K | 508.00K | 199.00K | 521.00K |
| Gross Profit Ratio | 100.00% | -9.89% | -47.28% | -27.19% | 100.00% | 100.00% | 49.87% | 40.96% |
| Research & Development | 11.55M | 11.34M | 11.08M | 12.21M | 9.85M | 11.56M | 5.64M | 2.77M |
| General & Administrative | 0.00 | 0.00 | 16.16M | 18.97M | 18.51M | 14.74M | 6.67M | 3.57M |
| Selling & Marketing | 0.00 | 0.00 | 4.38M | 5.17M | 0.00 | 0.00 | 0.00 | 0.00 |
| SG&A | 10.97M | 15.38M | 20.54M | 24.14M | 18.51M | 14.74M | 6.67M | 3.57M |
| Other Expenses | 5.57M | 45.00K | 252.00K | 1.34M | 0.00 | 0.00 | 0.00 | 0.00 |
| Operating Expenses | 22.53M | 26.76M | 31.87M | 37.69M | 28.35M | 26.30M | 12.31M | 6.34M |
| Cost & Expenses | 22.53M | 55.32M | 67.00M | 46.97M | 28.35M | 26.30M | 12.51M | 7.09M |
| Interest Income | 60.00K | 17.00K | 557.00K | 1.60M | 1.52M | 0.00 | 0.00 | 0.00 |
| Interest Expense | 75.00K | 1.43M | 1.44M | 1.49M | 1.26M | 1.00K | 5.00K | 261.00K |
| Depreciation & Amortization | 1.53M | 810.00K | 3.24M | 3.21M | 1.08M | 551.00K | 345.00K | 147.00K |
| EBITDA | -22.37M | -28.52M | -40.59M | -36.47M | -28.12M | -25.79M | -11.74M | -5.48M |
| EBITDA Ratio | -14,248.41% | -109.75% | -170.19% | -499.81% | -10,830.08% | -5,005.51% | -2,941.35% | -430.90% |
| Operating Income | -22.37M | -29.33M | -43.83M | -39.67M | -28.12M | -25.79M | -12.11M | -5.81M |
| Operating Income Ratio | -14,248.41% | -112.87% | -183.77% | -543.76% | -11,913.14% | -5,076.57% | -3,034.84% | -457.08% |
| Total Other Income/Expenses | 5.48M | 133.00K | -1.00M | 61.00K | 218.00K | -191.00K | 23.00K | -75.00K |
| Income Before Tax | -16.89M | -29.20M | -44.84M | -39.61M | -27.90M | -25.98M | -12.09M | -5.89M |
| Income Before Tax Ratio | -10,758.60% | -112.36% | -187.98% | -542.93% | -11,820.76% | -5,114.17% | -3,029.07% | -462.97% |
| Income Tax Expense | -7.09M | -114.00K | 1.56M | 1.49M | 1.48M | -190.00K | 28.00K | 186.00K |
| Net Income | -9.80M | -29.09M | -46.40M | -41.10M | -27.90M | -25.98M | -12.09M | -5.89M |
| Net Income Ratio | -6,243.95% | -111.92% | -194.54% | -563.35% | -11,820.76% | -5,114.17% | -3,029.07% | -462.97% |
| EPS | -10.66 | -38.81 | -68.47 | -62.64 | -0.91 | -1.12 | -0.45 | -0.22 |
| EPS Diluted | -10.66 | -38.81 | -68.47 | -62.64 | -0.91 | -1.12 | -0.45 | -0.22 |
| Weighted Avg Shares Out | 919.95K | 749.52K | 677.65K | 656.11K | 30.68M | 23.15M | 26.60M | 26.60M |
| Weighted Avg Shares Out (Dil) | 919.95K | 749.52K | 677.65K | 656.11K | 30.68M | 23.15M | 26.60M | 26.60M |

Calyxt to Host Virtual Analyst Day on Tuesday, November 17, 2020 at 4:00 p.m. Eastern Time

Financial Comparison: China Agri-Business (OTCMKTS:CHBU) & Calyxt (OTCMKTS:CLXT)

Calyxt to Host Third Quarter 2020 Financial Results Conference Call on Thursday, November 5, 2020 at 4:30 p.m. Eastern Time

Bankruptcy Update: Ruby Tuesday Files Chapter 11 While Progress Slows For JCPenney

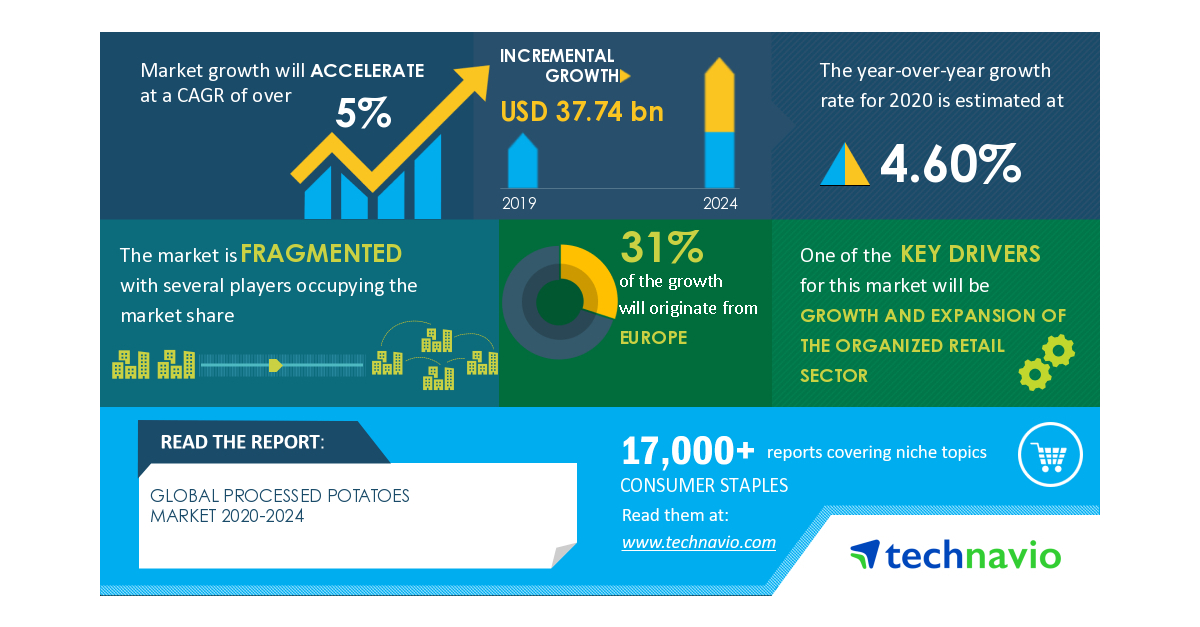
Processed Potatoes Market to Reach USD 37.74 bn by 2024, Burts Potato Chips Ltd. and Calbee Inc. Emerge as Key Contributors to Growth | Technavio

Centric Brands Announces Confirmation of Plan of Reorganization

Century 21, J.C. Penney And J. Crew Are Just 3 Retailers On A Long List Of 2020 Bankruptcies

Calyxt -Shareholder Analyst Call

Calyxt to Present at Upcoming September Investor Conferences

Calyxt to Host Second Quarter 2020 Financial Results Conference Call on Thursday, August 6, 2020 at 8:00 a.m. Eastern Time
Source: https://incomestatements.info
Category: Stock Reports
