See more : DTCOM – Direct to Company S.A. (DTCY3.SA) Income Statement Analysis – Financial Results
Complete financial analysis of Calyxt, Inc. (CLXT) income statement, including revenue, profit margins, EPS and key performance metrics. Get detailed insights into the financial performance of Calyxt, Inc., a leading company in the Packaged Foods industry within the Consumer Defensive sector.
- Nkarta, Inc. (NKTX) Income Statement Analysis – Financial Results
- Arbor Metals Corp. (ABRMF) Income Statement Analysis – Financial Results
- Amara Holdings Limited (A34.SI) Income Statement Analysis – Financial Results
- Edesa Biotech, Inc. (EDSA) Income Statement Analysis – Financial Results
- Eagle Industry Co.,Ltd. (6486.T) Income Statement Analysis – Financial Results
Calyxt, Inc. (CLXT)
About Calyxt, Inc.
Calyxt, Inc., a synthetic biology company, engages in delivering plant-based solutions primarily to the agriculture end market in the United States. The company is involved in the development of improved digestibility alfalfa; hemp; and wheat with a higher fiber content. It has a commercialization agreement with S&W Seed Company for the exclusive license of an improved quality alfalfa seed in the United States and internationally. The company was formerly known as Cellectis Plant Sciences, Inc. and changed its name to Calyxt, Inc. in May 2015. Calyxt, Inc. was incorporated in 2010 and is headquartered in Roseville, Minnesota. Calyxt, Inc. is a subsidiary of Cellectis S.A.
| Metric | 2022 | 2021 | 2020 | 2019 | 2018 | 2017 | 2016 | 2015 |
|---|---|---|---|---|---|---|---|---|
| Revenue | 157.00K | 25.99M | 23.85M | 7.30M | 236.00K | 508.00K | 399.00K | 1.27M |
| Cost of Revenue | 0.00 | 28.56M | 35.13M | 9.28M | 0.00 | 0.00 | 200.00K | 751.00K |
| Gross Profit | 157.00K | -2.57M | -11.28M | -1.98M | 236.00K | 508.00K | 199.00K | 521.00K |
| Gross Profit Ratio | 100.00% | -9.89% | -47.28% | -27.19% | 100.00% | 100.00% | 49.87% | 40.96% |
| Research & Development | 11.55M | 11.34M | 11.08M | 12.21M | 9.85M | 11.56M | 5.64M | 2.77M |
| General & Administrative | 0.00 | 0.00 | 16.16M | 18.97M | 18.51M | 14.74M | 6.67M | 3.57M |
| Selling & Marketing | 0.00 | 0.00 | 4.38M | 5.17M | 0.00 | 0.00 | 0.00 | 0.00 |
| SG&A | 10.97M | 15.38M | 20.54M | 24.14M | 18.51M | 14.74M | 6.67M | 3.57M |
| Other Expenses | 5.57M | 45.00K | 252.00K | 1.34M | 0.00 | 0.00 | 0.00 | 0.00 |
| Operating Expenses | 22.53M | 26.76M | 31.87M | 37.69M | 28.35M | 26.30M | 12.31M | 6.34M |
| Cost & Expenses | 22.53M | 55.32M | 67.00M | 46.97M | 28.35M | 26.30M | 12.51M | 7.09M |
| Interest Income | 60.00K | 17.00K | 557.00K | 1.60M | 1.52M | 0.00 | 0.00 | 0.00 |
| Interest Expense | 75.00K | 1.43M | 1.44M | 1.49M | 1.26M | 1.00K | 5.00K | 261.00K |
| Depreciation & Amortization | 1.53M | 810.00K | 3.24M | 3.21M | 1.08M | 551.00K | 345.00K | 147.00K |
| EBITDA | -22.37M | -28.52M | -40.59M | -36.47M | -28.12M | -25.79M | -11.74M | -5.48M |
| EBITDA Ratio | -14,248.41% | -109.75% | -170.19% | -499.81% | -10,830.08% | -5,005.51% | -2,941.35% | -430.90% |
| Operating Income | -22.37M | -29.33M | -43.83M | -39.67M | -28.12M | -25.79M | -12.11M | -5.81M |
| Operating Income Ratio | -14,248.41% | -112.87% | -183.77% | -543.76% | -11,913.14% | -5,076.57% | -3,034.84% | -457.08% |
| Total Other Income/Expenses | 5.48M | 133.00K | -1.00M | 61.00K | 218.00K | -191.00K | 23.00K | -75.00K |
| Income Before Tax | -16.89M | -29.20M | -44.84M | -39.61M | -27.90M | -25.98M | -12.09M | -5.89M |
| Income Before Tax Ratio | -10,758.60% | -112.36% | -187.98% | -542.93% | -11,820.76% | -5,114.17% | -3,029.07% | -462.97% |
| Income Tax Expense | -7.09M | -114.00K | 1.56M | 1.49M | 1.48M | -190.00K | 28.00K | 186.00K |
| Net Income | -9.80M | -29.09M | -46.40M | -41.10M | -27.90M | -25.98M | -12.09M | -5.89M |
| Net Income Ratio | -6,243.95% | -111.92% | -194.54% | -563.35% | -11,820.76% | -5,114.17% | -3,029.07% | -462.97% |
| EPS | -10.66 | -38.81 | -68.47 | -62.64 | -0.91 | -1.12 | -0.45 | -0.22 |
| EPS Diluted | -10.66 | -38.81 | -68.47 | -62.64 | -0.91 | -1.12 | -0.45 | -0.22 |
| Weighted Avg Shares Out | 919.95K | 749.52K | 677.65K | 656.11K | 30.68M | 23.15M | 26.60M | 26.60M |
| Weighted Avg Shares Out (Dil) | 919.95K | 749.52K | 677.65K | 656.11K | 30.68M | 23.15M | 26.60M | 26.60M |

Calyxt Announces Board Changes

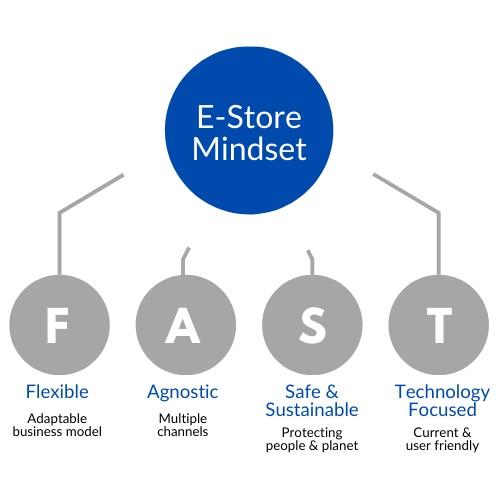
FAST: Future Proofing The Retail Food Industry

How Centric Plans to Transform the Face of Cryptocurrency | Coinspeaker

Specialty Food Ingredients Market 2020 Global Top Countries Industry Size, Share, Business Growth, Revenue, Trends, Global Market Demand Penetration and Forecast to 2024

5 Crypto Executive Predictions On Where The Economy Is Headed

Centric Software's Easy Digital Collaboration With Personal PLM

Specialty Food Ingredients Market 2020 Global Covid-19 Impact Analysis, Trends, Opportunities and Forecast to 2026

Centric Brands Files for Bankruptcy

Calyxt's (CLXT) CEO Jim Blome on Q1 2020 Results - Earnings Call Transcript
Source: https://incomestatements.info
Category: Stock Reports

