See more : PT Dewi Shri Farmindo Tbk. (DEWI.JK) Income Statement Analysis – Financial Results
Complete financial analysis of Copper Fox Metals Inc. (CPFXF) income statement, including revenue, profit margins, EPS and key performance metrics. Get detailed insights into the financial performance of Copper Fox Metals Inc., a leading company in the Copper industry within the Basic Materials sector.
- Bank of Montreal (BMO-PF.TO) Income Statement Analysis – Financial Results
- COFCO Joycome Foods Limited (1610.HK) Income Statement Analysis – Financial Results
- Hudson Global, Inc. (HSON) Income Statement Analysis – Financial Results
- Rexel S.A. (RXL.PA) Income Statement Analysis – Financial Results
- N.K Industries Limited (NKIND.BO) Income Statement Analysis – Financial Results
Copper Fox Metals Inc. (CPFXF)
About Copper Fox Metals Inc.
Copper Fox Metals Inc., a resource company, engages in the exploration and development of copper mineral properties in Canada and the United States. The company's principal asset is the Schaft Creek copper-gold-molybdenum-silver project located in northwestern British Columbia. It also holds interest in the Eaglehead porphyry copper project located in northern British Columbia. The company was incorporated in 2004 and is headquartered in Calgary, Canada.
| Metric | 2023 | 2022 | 2021 | 2020 | 2019 | 2018 | 2017 | 2016 | 2015 | 2014 | 2013 | 2012 | 2011 | 2010 | 2009 | 2008 | 2007 | 2006 | 2005 | 2004 |
|---|---|---|---|---|---|---|---|---|---|---|---|---|---|---|---|---|---|---|---|---|
| Revenue | 0.00 | 0.00 | 0.00 | 0.00 | 0.00 | 0.00 | 0.00 | 0.00 | 0.00 | 0.00 | 0.00 | 0.00 | 0.00 | 0.00 | 0.00 | 0.00 | 0.00 | 0.00 | 0.00 | 0.00 |
| Cost of Revenue | 16.68K | 14.28K | 19.52K | 27.65K | 22.30K | 22.89K | 26.27K | 31.39K | 35.93K | 42.39K | 121.99K | 164.82K | 0.00 | 0.00 | 0.00 | 0.00 | 0.00 | 0.00 | 0.00 | 0.00 |
| Gross Profit | -16.68K | -14.28K | -19.52K | -27.65K | -22.30K | -22.89K | -26.27K | -31.39K | -35.93K | -42.39K | -121.99K | -164.82K | 0.00 | 0.00 | 0.00 | 0.00 | 0.00 | 0.00 | 0.00 | 0.00 |
| Gross Profit Ratio | 0.00% | 0.00% | 0.00% | 0.00% | 0.00% | 0.00% | 0.00% | 0.00% | 0.00% | 0.00% | 0.00% | 0.00% | 0.00% | 0.00% | 0.00% | 0.00% | 0.00% | 0.00% | 0.00% | 0.00% |
| Research & Development | 0.00 | 0.00 | 0.00 | 0.00 | 0.00 | 0.00 | 0.00 | 0.00 | 0.00 | 0.00 | 0.00 | 0.00 | 0.00 | 0.00 | 0.00 | 0.00 | 0.00 | 0.00 | 0.00 | 0.00 |
| General & Administrative | 1.11M | 1.01M | 1.10M | 999.77K | 971.87K | 1.79M | 1.45M | 1.37M | 2.00M | 2.75M | 2.64M | 3.07M | 3.73M | 1.48M | 1.99M | 2.97M | 0.00 | 0.00 | 0.00 | 0.00 |
| Selling & Marketing | 0.00 | 0.00 | 0.00 | 0.00 | 0.00 | 0.00 | 0.00 | 0.00 | 0.00 | 0.00 | 0.00 | 0.00 | 0.00 | 0.00 | 0.00 | 0.00 | 0.00 | 0.00 | 0.00 | 0.00 |
| SG&A | 1.11M | 1.01M | 1.10M | 999.77K | 971.87K | 1.79M | 1.45M | 1.37M | 2.00M | 2.75M | 2.64M | 3.07M | 3.73M | 1.48M | 1.99M | 2.97M | 4.36M | 1.65M | 585.29K | 18.10K |
| Other Expenses | 0.00 | 0.00 | 0.00 | 0.00 | 0.00 | 0.00 | 0.00 | 0.00 | 0.00 | 0.00 | 0.00 | 0.00 | 0.00 | 0.00 | -9.77K | -51.15K | 0.00 | 0.00 | 0.00 | 0.00 |
| Operating Expenses | 1.11M | 1.01M | 1.10M | 999.77K | 971.87K | 1.79M | 1.45M | 1.37M | 2.00M | 2.75M | 2.64M | 3.24M | 3.88M | 1.61M | 2.15M | 3.01M | 4.55M | 1.70M | 589.86K | 19.08K |
| Cost & Expenses | 1.11M | 1.02M | 1.12M | 1.03M | 994.17K | 1.82M | 1.48M | 1.40M | 2.03M | 2.79M | 2.76M | 3.24M | 3.88M | 1.61M | 2.15M | 3.01M | 4.55M | 1.70M | 589.86K | 19.08K |
| Interest Income | 16.02K | 4.72K | 3.15K | 2.68K | 36.47K | 182.35K | 20.13K | 388.68K | 122.36K | 56.98K | 25.64K | 478.00 | 225.00 | 330.00 | 0.00 | 116.21K | 0.00 | 0.00 | 0.00 | 0.00 |
| Interest Expense | 0.00 | 0.00 | 0.00 | 0.00 | 0.00 | 0.00 | 0.00 | 0.00 | 0.00 | 0.00 | 0.00 | 0.00 | 0.00 | 0.00 | 0.00 | 0.00 | 0.00 | 0.00 | 0.00 | 0.00 |
| Depreciation & Amortization | 16.68K | 14.28K | 19.52K | 27.65K | 22.30K | 22.89K | 26.27K | 31.39K | 35.93K | 42.39K | 121.99K | 164.82K | 148.14K | 137.37K | 166.78K | 207.70K | 187.01K | 49.64K | 4.57K | 982.00 |
| EBITDA | -1.11M | -1.01M | -1.10M | -999.77K | 732.91K | -1.79M | -1.45M | -1.37M | -2.00M | -2.75M | -2.64M | -3.07M | -3.73M | -1.48M | 29.01M | -2.80M | -4.36M | -1.65M | -585.29K | -18.10K |
| EBITDA Ratio | 0.00% | 0.00% | 0.00% | 0.00% | 0.00% | 0.00% | 0.00% | 0.00% | 0.00% | 0.00% | 0.00% | 0.00% | 0.00% | 0.00% | 0.00% | 0.00% | 0.00% | 0.00% | 0.00% | 0.00% |
| Operating Income | -1.11M | -688.01K | -1.12M | -1.03M | 710.61K | -1.82M | -1.48M | -1.40M | -2.03M | -2.79M | -2.76M | -3.24M | -3.88M | -1.61M | 28.85M | -3.01M | -4.55M | -1.70M | -589.86K | -19.08K |
| Operating Income Ratio | 0.00% | 0.00% | 0.00% | 0.00% | 0.00% | 0.00% | 0.00% | 0.00% | 0.00% | 0.00% | 0.00% | 0.00% | 0.00% | 0.00% | 0.00% | 0.00% | 0.00% | 0.00% | 0.00% | 0.00% |
| Total Other Income/Expenses | -659.00 | -343.40K | -13.36K | -128.69K | -1.71M | 159.46K | -6.14K | -263.80K | 86.43K | 14.59K | 25.64K | 0.00 | 0.00 | 330.00 | -61.99M | 0.00 | 0.00 | 0.00 | 0.00 | 0.00 |
| Income Before Tax | -1.11M | -1.35M | -1.12M | -1.13M | -2.73M | -1.63M | -1.46M | -1.67M | -1.91M | -2.73M | -2.63M | -3.24M | -3.90M | -1.61M | -33.14M | -3.01M | 0.00 | 0.00 | 0.00 | 0.00 |
| Income Before Tax Ratio | 0.00% | 0.00% | 0.00% | 0.00% | 0.00% | 0.00% | 0.00% | 0.00% | 0.00% | 0.00% | 0.00% | 0.00% | 0.00% | 0.00% | 0.00% | 0.00% | 0.00% | 0.00% | 0.00% | 0.00% |
| Income Tax Expense | 0.00 | -60.00K | -254.00K | -591.00K | -101.16K | -264.90K | -255.20K | -596.21K | -363.95K | -1.38M | -4.01M | -29.27K | -225.00 | 0.00 | -4.62M | -2.27M | -132.56K | -43.85K | 780.00 | 0.00 |
| Net Income | -1.11M | -1.29M | -861.23K | -537.45K | -2.58M | -963.11K | -1.09M | -949.19K | -1.33M | -1.09M | 1.28M | -3.21M | -3.88M | -1.61M | -28.52M | -736.71K | -4.42M | -1.66M | -590.64K | -19.08K |
| Net Income Ratio | 0.00% | 0.00% | 0.00% | 0.00% | 0.00% | 0.00% | 0.00% | 0.00% | 0.00% | 0.00% | 0.00% | 0.00% | 0.00% | 0.00% | 0.00% | 0.00% | 0.00% | 0.00% | 0.00% | 0.00% |
| EPS | 0.00 | 0.00 | 0.00 | 0.00 | -0.01 | 0.00 | 0.00 | 0.00 | 0.00 | 0.00 | 0.00 | -0.01 | -0.01 | -0.01 | -0.19 | -0.01 | -0.06 | -0.04 | -0.02 | 0.00 |
| EPS Diluted | 0.00 | 0.00 | 0.00 | 0.00 | -0.01 | 0.00 | 0.00 | 0.00 | 0.00 | 0.00 | 0.00 | -0.01 | -0.01 | -0.01 | -0.19 | -0.01 | -0.06 | -0.04 | -0.02 | 0.00 |
| Weighted Avg Shares Out | 543.66M | 524.19M | 508.48M | 477.95M | 455.23M | 441.42M | 430.22M | 419.33M | 407.66M | 405.53M | 401.45M | 388.15M | 371.63M | 290.22M | 147.12M | 97.44M | 73.65M | 41.42M | 25.55M | 4.40M |
| Weighted Avg Shares Out (Dil) | 543.61M | 524.19M | 508.48M | 477.95M | 455.23M | 441.42M | 430.22M | 419.33M | 407.66M | 405.53M | 401.45M | 388.15M | 371.63M | 290.22M | 147.12M | 97.44M | 73.65M | 41.42M | 25.55M | 4.40M |

Copper Fox Metals encouraged by ongoing testing work at Van Dyke project
Copper Fox Metals updates on recent activities and plans for its Van Dyke in-situ copper recovery project
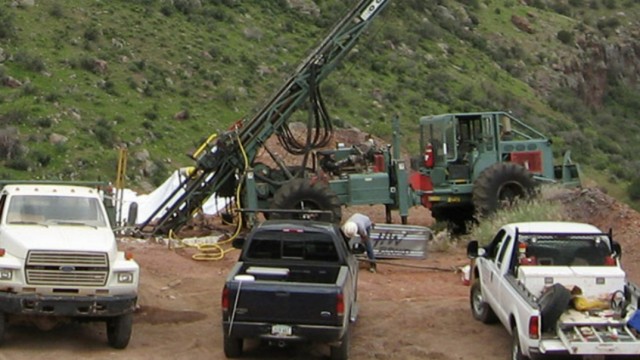
Copper Fox Metals outlines 2023 exploration plans for Mineral Mountain Copper Project
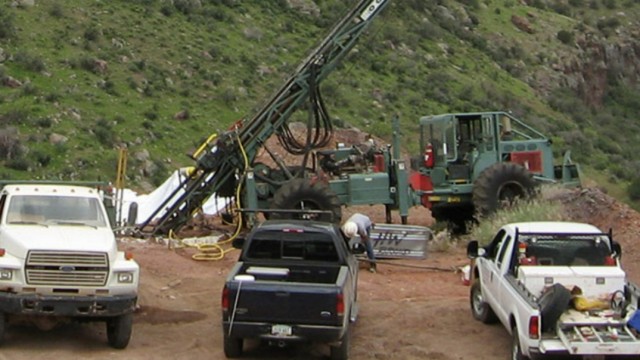
Copper Fox Metals announces results for 1Q ended January 31, 2023
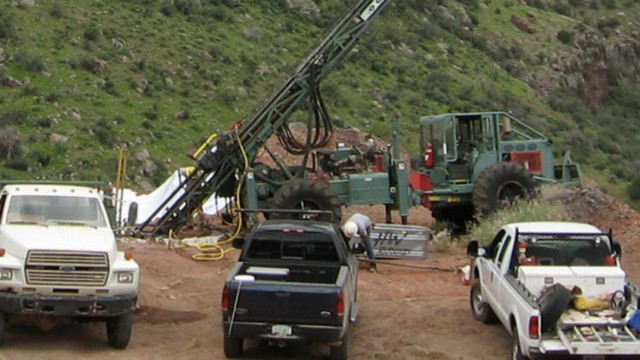
Copper Fox outlines busy 2023 work program to advance Schaft Creek copper-gold-silver project in British Columbia

Copper Fox Metals reports on progress made as it releases 2022 financial and operations results

Copper Fox Metals unveils partial assays from 2022 metallurgical drilling at Schaft Creek project
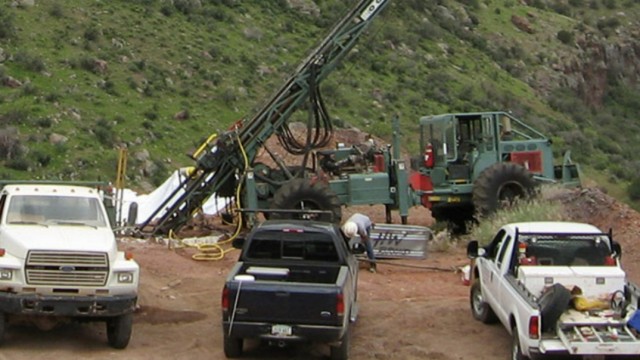
Copper Fox Metals updates on Eaglehead polymetallic porphyry copper project
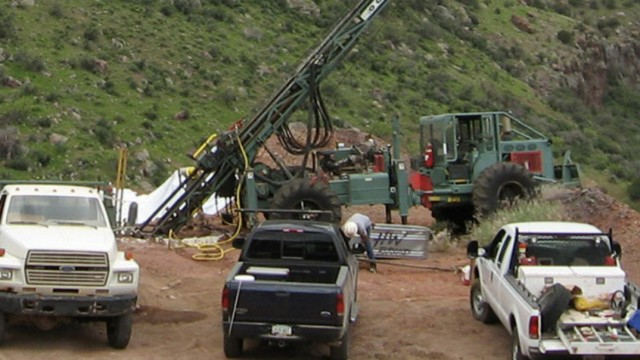
Copper Fox provides update on Van Dyke Copper Project

Copper Fox Metals completes metallurgical drilling program at Schaft Creek project
Source: https://incomestatements.info
Category: Stock Reports
