See more : Ponsse Oyj (0FNZ.L) Income Statement Analysis – Financial Results
Complete financial analysis of Copper Fox Metals Inc. (CPFXF) income statement, including revenue, profit margins, EPS and key performance metrics. Get detailed insights into the financial performance of Copper Fox Metals Inc., a leading company in the Copper industry within the Basic Materials sector.
- Sprouts Farmers Market, Inc. (SFM) Income Statement Analysis – Financial Results
- Beken Corporation (603068.SS) Income Statement Analysis – Financial Results
- Elliott Opportunity II Corp. (EOCW-UN) Income Statement Analysis – Financial Results
- Avient Corporation (AVNT) Income Statement Analysis – Financial Results
- The Travelers Companies, Inc. (0R03.L) Income Statement Analysis – Financial Results
Copper Fox Metals Inc. (CPFXF)
About Copper Fox Metals Inc.
Copper Fox Metals Inc., a resource company, engages in the exploration and development of copper mineral properties in Canada and the United States. The company's principal asset is the Schaft Creek copper-gold-molybdenum-silver project located in northwestern British Columbia. It also holds interest in the Eaglehead porphyry copper project located in northern British Columbia. The company was incorporated in 2004 and is headquartered in Calgary, Canada.
| Metric | 2023 | 2022 | 2021 | 2020 | 2019 | 2018 | 2017 | 2016 | 2015 | 2014 | 2013 | 2012 | 2011 | 2010 | 2009 | 2008 | 2007 | 2006 | 2005 | 2004 |
|---|---|---|---|---|---|---|---|---|---|---|---|---|---|---|---|---|---|---|---|---|
| Revenue | 0.00 | 0.00 | 0.00 | 0.00 | 0.00 | 0.00 | 0.00 | 0.00 | 0.00 | 0.00 | 0.00 | 0.00 | 0.00 | 0.00 | 0.00 | 0.00 | 0.00 | 0.00 | 0.00 | 0.00 |
| Cost of Revenue | 16.68K | 14.28K | 19.52K | 27.65K | 22.30K | 22.89K | 26.27K | 31.39K | 35.93K | 42.39K | 121.99K | 164.82K | 0.00 | 0.00 | 0.00 | 0.00 | 0.00 | 0.00 | 0.00 | 0.00 |
| Gross Profit | -16.68K | -14.28K | -19.52K | -27.65K | -22.30K | -22.89K | -26.27K | -31.39K | -35.93K | -42.39K | -121.99K | -164.82K | 0.00 | 0.00 | 0.00 | 0.00 | 0.00 | 0.00 | 0.00 | 0.00 |
| Gross Profit Ratio | 0.00% | 0.00% | 0.00% | 0.00% | 0.00% | 0.00% | 0.00% | 0.00% | 0.00% | 0.00% | 0.00% | 0.00% | 0.00% | 0.00% | 0.00% | 0.00% | 0.00% | 0.00% | 0.00% | 0.00% |
| Research & Development | 0.00 | 0.00 | 0.00 | 0.00 | 0.00 | 0.00 | 0.00 | 0.00 | 0.00 | 0.00 | 0.00 | 0.00 | 0.00 | 0.00 | 0.00 | 0.00 | 0.00 | 0.00 | 0.00 | 0.00 |
| General & Administrative | 1.11M | 1.01M | 1.10M | 999.77K | 971.87K | 1.79M | 1.45M | 1.37M | 2.00M | 2.75M | 2.64M | 3.07M | 3.73M | 1.48M | 1.99M | 2.97M | 0.00 | 0.00 | 0.00 | 0.00 |
| Selling & Marketing | 0.00 | 0.00 | 0.00 | 0.00 | 0.00 | 0.00 | 0.00 | 0.00 | 0.00 | 0.00 | 0.00 | 0.00 | 0.00 | 0.00 | 0.00 | 0.00 | 0.00 | 0.00 | 0.00 | 0.00 |
| SG&A | 1.11M | 1.01M | 1.10M | 999.77K | 971.87K | 1.79M | 1.45M | 1.37M | 2.00M | 2.75M | 2.64M | 3.07M | 3.73M | 1.48M | 1.99M | 2.97M | 4.36M | 1.65M | 585.29K | 18.10K |
| Other Expenses | 0.00 | 0.00 | 0.00 | 0.00 | 0.00 | 0.00 | 0.00 | 0.00 | 0.00 | 0.00 | 0.00 | 0.00 | 0.00 | 0.00 | -9.77K | -51.15K | 0.00 | 0.00 | 0.00 | 0.00 |
| Operating Expenses | 1.11M | 1.01M | 1.10M | 999.77K | 971.87K | 1.79M | 1.45M | 1.37M | 2.00M | 2.75M | 2.64M | 3.24M | 3.88M | 1.61M | 2.15M | 3.01M | 4.55M | 1.70M | 589.86K | 19.08K |
| Cost & Expenses | 1.11M | 1.02M | 1.12M | 1.03M | 994.17K | 1.82M | 1.48M | 1.40M | 2.03M | 2.79M | 2.76M | 3.24M | 3.88M | 1.61M | 2.15M | 3.01M | 4.55M | 1.70M | 589.86K | 19.08K |
| Interest Income | 16.02K | 4.72K | 3.15K | 2.68K | 36.47K | 182.35K | 20.13K | 388.68K | 122.36K | 56.98K | 25.64K | 478.00 | 225.00 | 330.00 | 0.00 | 116.21K | 0.00 | 0.00 | 0.00 | 0.00 |
| Interest Expense | 0.00 | 0.00 | 0.00 | 0.00 | 0.00 | 0.00 | 0.00 | 0.00 | 0.00 | 0.00 | 0.00 | 0.00 | 0.00 | 0.00 | 0.00 | 0.00 | 0.00 | 0.00 | 0.00 | 0.00 |
| Depreciation & Amortization | 16.68K | 14.28K | 19.52K | 27.65K | 22.30K | 22.89K | 26.27K | 31.39K | 35.93K | 42.39K | 121.99K | 164.82K | 148.14K | 137.37K | 166.78K | 207.70K | 187.01K | 49.64K | 4.57K | 982.00 |
| EBITDA | -1.11M | -1.01M | -1.10M | -999.77K | 732.91K | -1.79M | -1.45M | -1.37M | -2.00M | -2.75M | -2.64M | -3.07M | -3.73M | -1.48M | 29.01M | -2.80M | -4.36M | -1.65M | -585.29K | -18.10K |
| EBITDA Ratio | 0.00% | 0.00% | 0.00% | 0.00% | 0.00% | 0.00% | 0.00% | 0.00% | 0.00% | 0.00% | 0.00% | 0.00% | 0.00% | 0.00% | 0.00% | 0.00% | 0.00% | 0.00% | 0.00% | 0.00% |
| Operating Income | -1.11M | -688.01K | -1.12M | -1.03M | 710.61K | -1.82M | -1.48M | -1.40M | -2.03M | -2.79M | -2.76M | -3.24M | -3.88M | -1.61M | 28.85M | -3.01M | -4.55M | -1.70M | -589.86K | -19.08K |
| Operating Income Ratio | 0.00% | 0.00% | 0.00% | 0.00% | 0.00% | 0.00% | 0.00% | 0.00% | 0.00% | 0.00% | 0.00% | 0.00% | 0.00% | 0.00% | 0.00% | 0.00% | 0.00% | 0.00% | 0.00% | 0.00% |
| Total Other Income/Expenses | -659.00 | -343.40K | -13.36K | -128.69K | -1.71M | 159.46K | -6.14K | -263.80K | 86.43K | 14.59K | 25.64K | 0.00 | 0.00 | 330.00 | -61.99M | 0.00 | 0.00 | 0.00 | 0.00 | 0.00 |
| Income Before Tax | -1.11M | -1.35M | -1.12M | -1.13M | -2.73M | -1.63M | -1.46M | -1.67M | -1.91M | -2.73M | -2.63M | -3.24M | -3.90M | -1.61M | -33.14M | -3.01M | 0.00 | 0.00 | 0.00 | 0.00 |
| Income Before Tax Ratio | 0.00% | 0.00% | 0.00% | 0.00% | 0.00% | 0.00% | 0.00% | 0.00% | 0.00% | 0.00% | 0.00% | 0.00% | 0.00% | 0.00% | 0.00% | 0.00% | 0.00% | 0.00% | 0.00% | 0.00% |
| Income Tax Expense | 0.00 | -60.00K | -254.00K | -591.00K | -101.16K | -264.90K | -255.20K | -596.21K | -363.95K | -1.38M | -4.01M | -29.27K | -225.00 | 0.00 | -4.62M | -2.27M | -132.56K | -43.85K | 780.00 | 0.00 |
| Net Income | -1.11M | -1.29M | -861.23K | -537.45K | -2.58M | -963.11K | -1.09M | -949.19K | -1.33M | -1.09M | 1.28M | -3.21M | -3.88M | -1.61M | -28.52M | -736.71K | -4.42M | -1.66M | -590.64K | -19.08K |
| Net Income Ratio | 0.00% | 0.00% | 0.00% | 0.00% | 0.00% | 0.00% | 0.00% | 0.00% | 0.00% | 0.00% | 0.00% | 0.00% | 0.00% | 0.00% | 0.00% | 0.00% | 0.00% | 0.00% | 0.00% | 0.00% |
| EPS | 0.00 | 0.00 | 0.00 | 0.00 | -0.01 | 0.00 | 0.00 | 0.00 | 0.00 | 0.00 | 0.00 | -0.01 | -0.01 | -0.01 | -0.19 | -0.01 | -0.06 | -0.04 | -0.02 | 0.00 |
| EPS Diluted | 0.00 | 0.00 | 0.00 | 0.00 | -0.01 | 0.00 | 0.00 | 0.00 | 0.00 | 0.00 | 0.00 | -0.01 | -0.01 | -0.01 | -0.19 | -0.01 | -0.06 | -0.04 | -0.02 | 0.00 |
| Weighted Avg Shares Out | 543.66M | 524.19M | 508.48M | 477.95M | 455.23M | 441.42M | 430.22M | 419.33M | 407.66M | 405.53M | 401.45M | 388.15M | 371.63M | 290.22M | 147.12M | 97.44M | 73.65M | 41.42M | 25.55M | 4.40M |
| Weighted Avg Shares Out (Dil) | 543.61M | 524.19M | 508.48M | 477.95M | 455.23M | 441.42M | 430.22M | 419.33M | 407.66M | 405.53M | 401.45M | 388.15M | 371.63M | 290.22M | 147.12M | 97.44M | 73.65M | 41.42M | 25.55M | 4.40M |
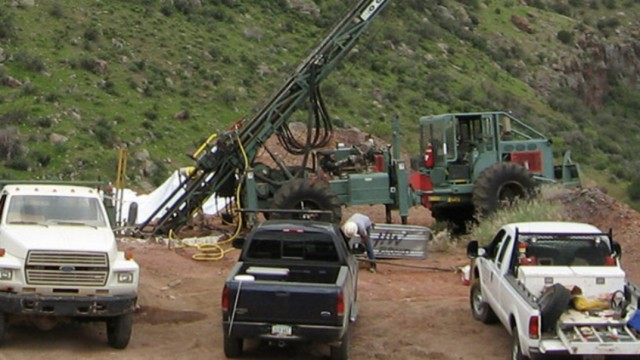
Copper Fox Metals releases results of Biological Evaluation at Van Dyke Copper Project; plans to commence Phase 1 activities
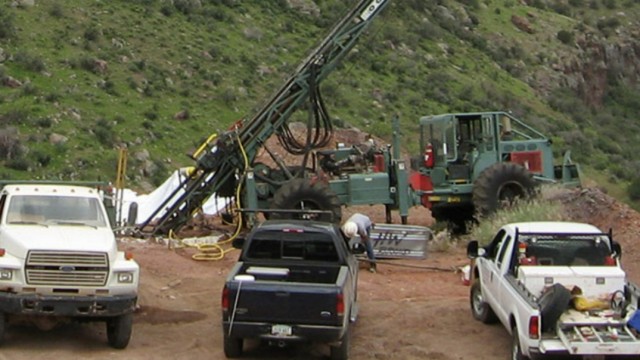
Copper Fox Metals updates on Eaglehead polymetallic porphyry copper project in British Columbia
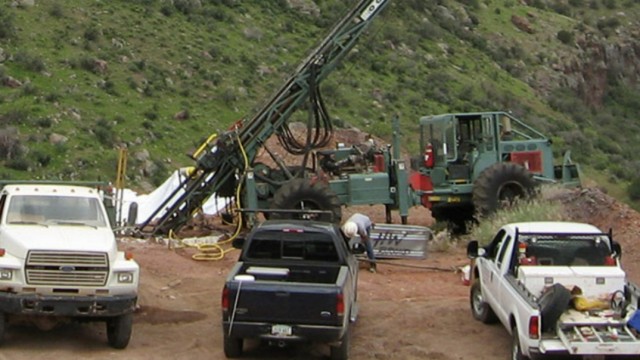
Copper Fox Metals updates on Mineral Mountain project

Copper Fox Metals eyeing start of drilling at Eaglehead polymetallic porphyry copper project in BC

Copper Fox Metals updates on Schaft Creek joint venture where this year's drill program has started

Copper Fox Metals to advance its Van Dyke copper project in Arizona towards preliminary feasibility stage through staged, multi-purpose program
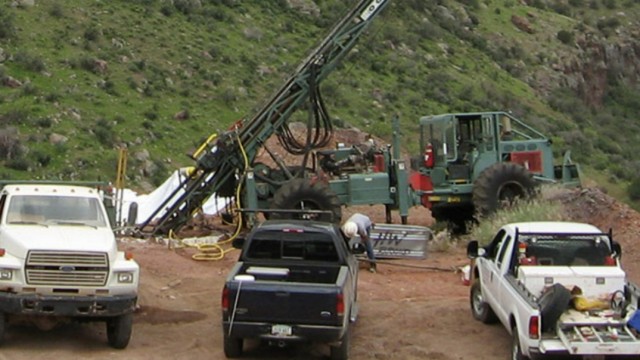
Analyst View: Copper Fox Metals' Sombrero Butte geophysics suggests presence of a buried porphyry
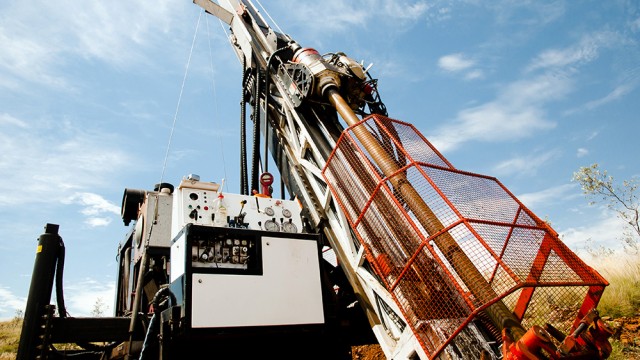
Copper Fox Metals set to kick off drilling at its Eaglehead project in British Columbia

Copper Fox Metals CEO says investors can expect significant news flow over the coming months

Copper Fox Metals poised to advance its assets for the 'green economy' as it reports its second quarter results
Source: https://incomestatements.info
Category: Stock Reports
