See more : Tokyotokeiba Co.,Ltd. (9672.T) Income Statement Analysis – Financial Results
Complete financial analysis of Tritium DCFC Limited (DCFC) income statement, including revenue, profit margins, EPS and key performance metrics. Get detailed insights into the financial performance of Tritium DCFC Limited, a leading company in the Electrical Equipment & Parts industry within the Industrials sector.
- NICE Ltd. (NICE) Income Statement Analysis – Financial Results
- Better For You Wellness, Inc. (BFYW) Income Statement Analysis – Financial Results
- Quest for Growth Belgium (QGPLF) Income Statement Analysis – Financial Results
- Archer Limited (ARHVF) Income Statement Analysis – Financial Results
- Big Camera Corporation Public Company Limited (BIG.BK) Income Statement Analysis – Financial Results
Tritium DCFC Limited (DCFC)
About Tritium DCFC Limited
Tritium DCFC Limited designs, manufactures, and supplies direct current chargers for electric vehicles in the United States, North America, Europe, the Middle East, and the Asia Pacific. The company's charging station hardware portfolio includes various standalone chargers, such as 50, 75, 175, and 350-kilowatt chargers. Its service and maintenance portfolio includes warranties, service level agreements, and spare parts. The company provides approximately 3.6 million high-power charging sessions. It serves charge point operators, automakers, electric vehicle fleets, and fuel stations, as well as retail and utility sectors. The company is based in Murarrie, Australia.
| Metric | 2022 | 2021 | 2020 | 2019 |
|---|---|---|---|---|
| Revenue | 184.54M | 85.82M | 56.16M | 46.97M |
| Cost of Revenue | 188.63M | 89.10M | 60.37M | 49.25M |
| Gross Profit | -4.08M | -3.28M | -4.22M | -2.28M |
| Gross Profit Ratio | -2.21% | -3.82% | -7.51% | -4.86% |
| Research & Development | 15.47M | 14.03M | 10.52M | 9.55M |
| General & Administrative | 70.80M | 72.10M | 28.60M | 21.78M |
| Selling & Marketing | 1.13M | 449.00K | 188.00K | 304.00K |
| SG&A | 71.93M | 72.74M | 29.31M | 22.31M |
| Other Expenses | 0.00 | 36.00K | 171.00K | 3.00K |
| Operating Expenses | 93.82M | 86.77M | 39.83M | 31.85M |
| Cost & Expenses | 283.66M | 175.87M | 100.21M | 81.11M |
| Interest Income | 147.00K | 7.00K | 12.00K | 18.00K |
| Interest Expense | 35.05M | 17.14M | 8.59M | 1.51M |
| Depreciation & Amortization | 2.43M | 2.20M | 2.31M | 1.31M |
| EBITDA | -83.89M | -108.57M | -51.97M | -31.63M |
| EBITDA Ratio | -45.46% | -102.37% | -74.32% | -69.89% |
| Operating Income | -99.12M | -90.05M | -44.05M | -34.14M |
| Operating Income Ratio | -53.71% | -104.93% | -78.44% | -72.68% |
| Total Other Income/Expenses | -22.25M | -38.85M | -19.03M | -307.00K |
| Income Before Tax | -121.37M | -128.90M | -63.08M | -34.44M |
| Income Before Tax Ratio | -65.77% | -150.20% | -112.33% | -73.33% |
| Income Tax Expense | 0.00 | 20.00K | 11.00K | 0.00 |
| Net Income | -121.37M | -128.92M | -63.09M | -34.44M |
| Net Income Ratio | -65.77% | -150.22% | -112.35% | -73.33% |
| EPS | -156.20 | -203.32 | -116.87 | -63.80 |
| EPS Diluted | -156.20 | -203.32 | -116.87 | -63.80 |
| Weighted Avg Shares Out | 777.00K | 634.07K | 539.84K | 539.84K |
| Weighted Avg Shares Out (Dil) | 777.01K | 634.07K | 539.84K | 539.84K |
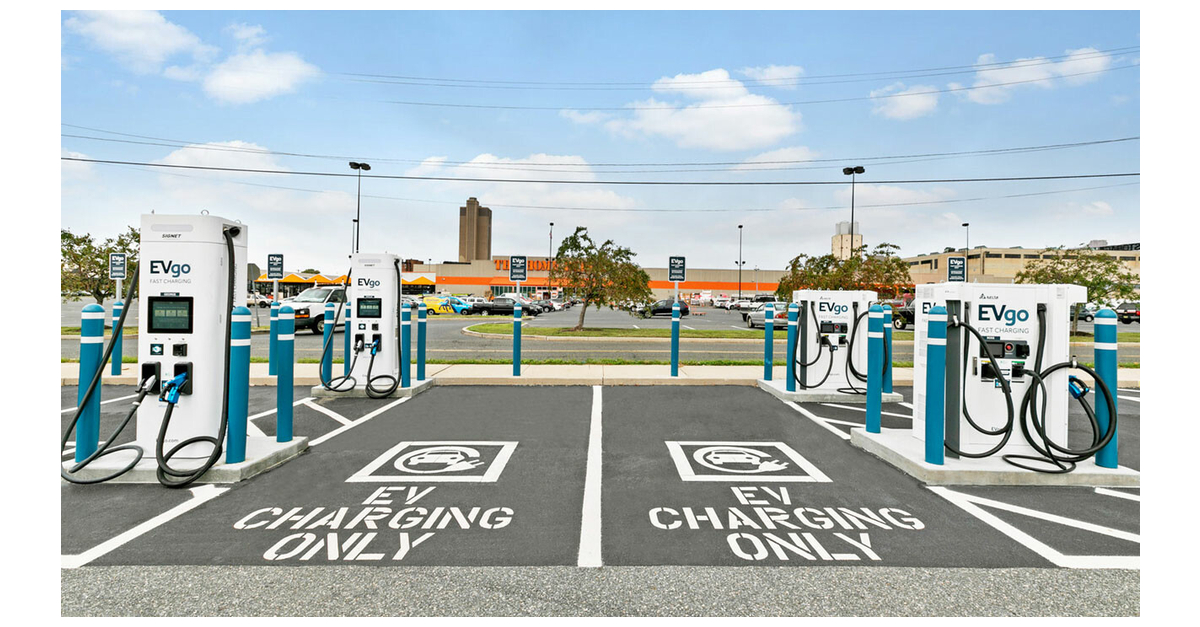
City of Philadelphia Partners with EVgo to Support Electrification of Municipal Fleet

Tritium Appoints Adam Walker, an Accomplished Executive
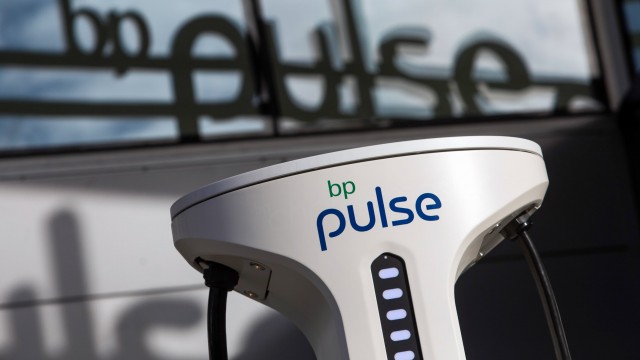
BP deal sends Nasdaq-listed EV charging stock Tritium surging
Tritium Stock Soars On Multi-Year Contract With BP
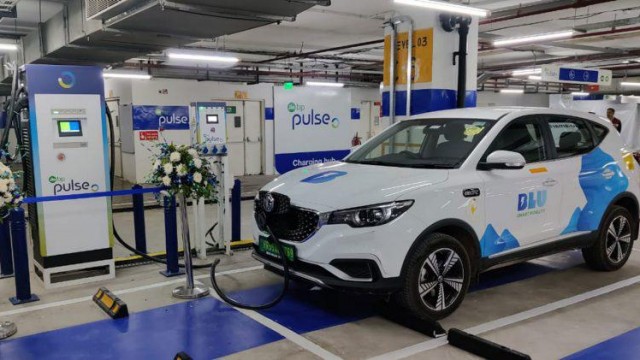
BP Chooses Tritium For Next Move Toward Global EV Charging Expansion
Why Tritium DCFC Stock Skyrocketed 36.4% in March
3 Lesser-Known Electric Vehicle Stocks That May Surprise Everyone in the EV Race

Tritium Is Another SPAC Story with Drama, Excitement and Poor Fundamentals

Why Tritium DCFC Limited Stock Rose 15.7% on Wednesday

Why Tritium DCFC Stock Keeps Falling
Source: https://incomestatements.info
Category: Stock Reports
