See more : Guangzhou Grandbuy Co., Ltd. (002187.SZ) Income Statement Analysis – Financial Results
Complete financial analysis of Delaware Investments Dividend and Income Fund, Inc. (DDF) income statement, including revenue, profit margins, EPS and key performance metrics. Get detailed insights into the financial performance of Delaware Investments Dividend and Income Fund, Inc., a leading company in the Asset Management – Income industry within the Financial Services sector.
- Enovix Corporation (ENVX) Income Statement Analysis – Financial Results
- KCR Residential REIT plc (KCR.L) Income Statement Analysis – Financial Results
- Cvent Holding Corp. (CVT) Income Statement Analysis – Financial Results
- Christian Dior SE (CHDRY) Income Statement Analysis – Financial Results
- Utilico Emerging Markets Trust PLC (UEM.L) Income Statement Analysis – Financial Results
Delaware Investments Dividend and Income Fund, Inc. (DDF)
Industry: Asset Management - Income
Sector: Financial Services
About Delaware Investments Dividend and Income Fund, Inc.
Delaware Investments Dividend and Income Fund, Inc. is a closed-ended equity mutual fund launched by Delaware Management Holdings, Inc. It is managed by Delaware Management Company. The fund invests in public equity markets of the United States. It seeks to invest in stocks of companies operating across diversified sectors. The fund primarily invests in dividend paying value stocks of large cap companies. It benchmarks the performance of its portfolio against the S&P 500 Index and the Lipper Closed-End Income and Preferred Stock Funds Average. Delaware Investments Dividend and Income Fund, Inc. was formed on March 26, 1993 and is domiciled in the United States.
| Metric | 2022 | 2021 | 2020 | 2019 | 2018 | 2017 | 2010 |
|---|---|---|---|---|---|---|---|
| Revenue | 225.61K | 13.80M | -3.97M | 8.48M | 2.66M | 13.04M | 0.00 |
| Cost of Revenue | 0.00 | 0.00 | 0.00 | 0.00 | 0.00 | 0.00 | 0.00 |
| Gross Profit | 225.61K | 13.80M | -3.97M | 8.48M | 2.66M | 13.04M | 0.00 |
| Gross Profit Ratio | 100.00% | 100.00% | 100.00% | 100.00% | 100.00% | 100.00% | 0.00% |
| Research & Development | 0.00 | 0.00 | 0.00 | 0.00 | 0.00 | 0.00 | 0.00 |
| General & Administrative | 382.05K | 408.44K | 424.40K | 761.23K | 333.18K | 319.28K | 0.00 |
| Selling & Marketing | 0.00 | 0.00 | 0.00 | 0.00 | 0.00 | 0.00 | 0.00 |
| SG&A | 382.05K | 408.44K | 424.40K | 761.23K | 333.18K | 319.28K | 0.00 |
| Other Expenses | 104.54K | 107.49K | 102.90K | 89.72K | 78.10K | 0.00 | 0.00 |
| Operating Expenses | 486.59K | 515.94K | 527.30K | 850.95K | 411.28K | 432.12K | 0.00 |
| Cost & Expenses | 486.59K | 515.94K | 527.30K | 850.95K | 411.28K | 432.12K | 0.00 |
| Interest Income | 1.39M | 1.57M | 1.65M | 2.74M | 2.32M | 2.51M | 0.00 |
| Interest Expense | 607.83K | 291.16K | 432.85K | 1.13M | 1.10M | 766.62K | 0.00 |
| Depreciation & Amortization | 228.49K | 236.56K | 206.30K | 171.86K | 161.14K | 52.52K | 0.00 |
| EBITDA | 346.85K | 13.28M | -4.50M | 7.63M | 3.34M | 12.60M | 0.00 |
| EBITDA Ratio | 153.74% | 96.26% | 113.27% | 89.97% | 125.82% | 96.69% | 0.00% |
| Operating Income | 346.85K | 13.28M | -4.50M | 7.63M | 3.34M | 12.60M | 0.00 |
| Operating Income Ratio | 153.74% | 96.26% | 113.27% | 89.97% | 125.82% | 96.69% | 0.00% |
| Total Other Income/Expenses | 0.00 | 0.00 | 0.00 | 0.00 | 0.00 | 0.00 | 0.00 |
| Income Before Tax | -260.98K | 13.28M | -4.50M | 7.63M | 2.24M | 12.60M | 0.00 |
| Income Before Tax Ratio | -115.68% | 96.26% | 113.27% | 89.97% | 84.51% | 96.69% | 0.00% |
| Income Tax Expense | 0.00 | 0.00 | 0.00 | 0.00 | 0.00 | 0.00 | 0.00 |
| Net Income | -260.98K | 13.28M | -4.50M | 7.63M | 2.24M | 12.60M | 0.00 |
| Net Income Ratio | -115.68% | 96.26% | 113.27% | 89.97% | 84.51% | 96.69% | 0.00% |
| EPS | -0.03 | 1.74 | -0.57 | 0.99 | 0.29 | 1.61 | 0.00 |
| EPS Diluted | -0.03 | 1.74 | -0.57 | 0.99 | 0.29 | 1.61 | 0.00 |
| Weighted Avg Shares Out | 7.63M | 7.63M | 7.89M | 7.71M | 7.74M | 7.83M | 9.44M |
| Weighted Avg Shares Out (Dil) | 7.63M | 7.63M | 7.89M | 7.71M | 7.74M | 7.83M | 9.44M |

Equity CEFs: How Good Is Mr. Market At Predicting A CEF's Future?

Statement Pursuant to Section 19(a) of the Investment Company Act of 1940: DDF

Statement Pursuant to Section 19(a) of the Investment Company Act of 1940: DDF

Healthcare REITs: Signs Of Life
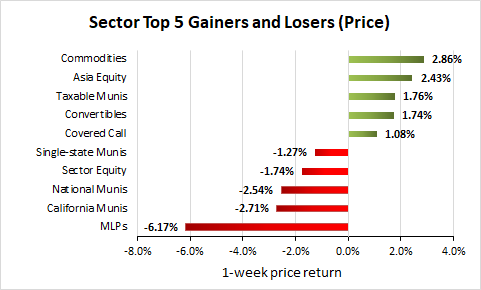
Weekly Closed-End Fund Roundup: August 30, 2020
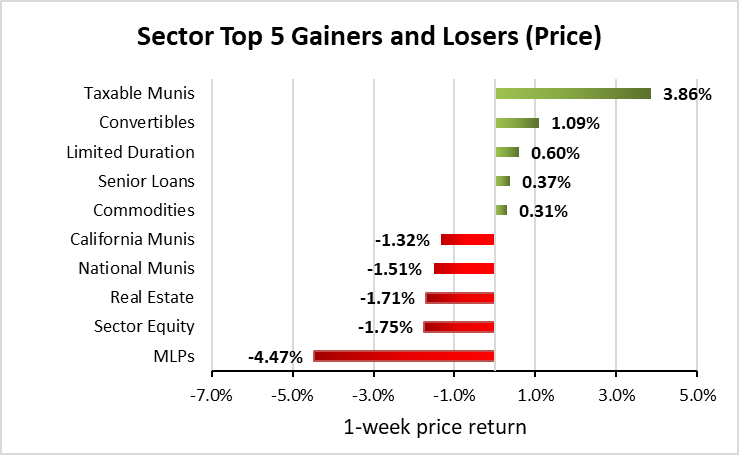
Weekly Closed-End Fund Roundup: August 23, 2020
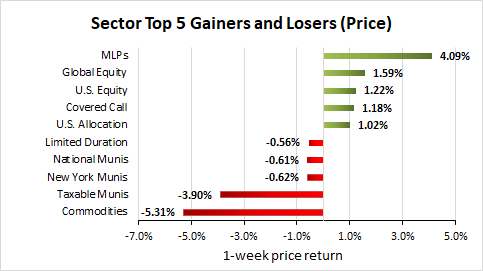
Weekly Closed-End Fund Roundup: MAV Boosts Again (August 16, 2020)
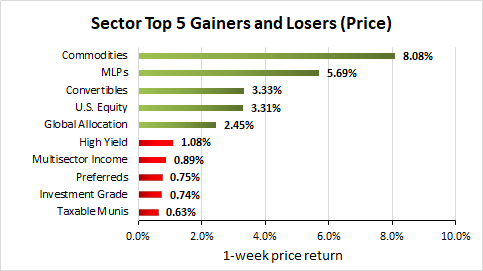
Weekly Closed-End Fund Roundup: August 9, 2020
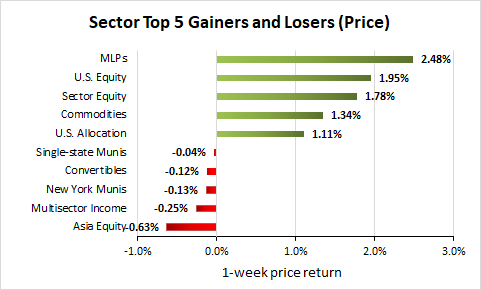
Weekly Closed-End Fund Roundup: July 19, 2020
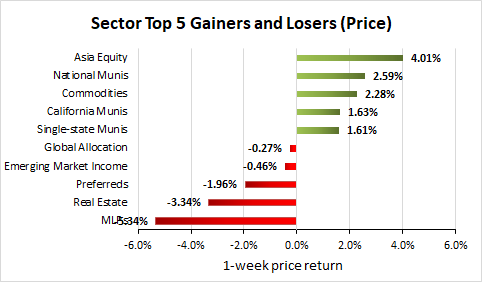
Weekly Closed-End Fund Roundup: TYG/NTG Reinstates Distributions (July 12, 2020)
Source: https://incomestatements.info
Category: Stock Reports
