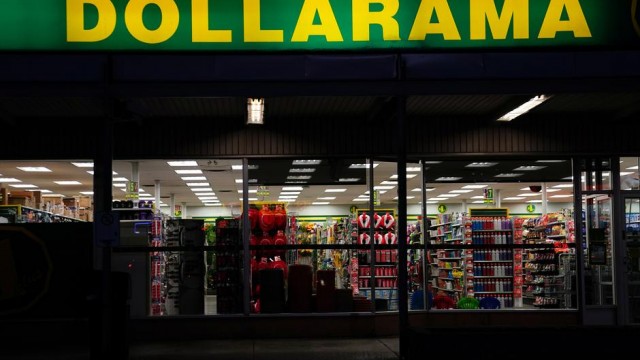
Complete financial analysis of Dollarama Inc. (DLMAF) income statement, including revenue, profit margins, EPS and key performance metrics. Get detailed insights into the financial performance of Dollarama Inc., a leading company in the Discount Stores industry within the Consumer Defensive sector.
- ITAB Shop Concept AB (publ) (ITAB.ST) Income Statement Analysis – Financial Results
- Neonode Inc. (NEON) Income Statement Analysis – Financial Results
- Dhampur Bio Organics Limited (DBOL.BO) Income Statement Analysis – Financial Results
- African Media Entertainment Limited (AME.JO) Income Statement Analysis – Financial Results
- Max Ventures and Industries Limited (MAXVIL.NS) Income Statement Analysis – Financial Results
Dollarama Inc. (DLMAF)
About Dollarama Inc.
Dollarama Inc. operates a chain of dollar stores in Canada. Its stores offer general merchandise, consumables, and seasonal products. The company also sells its products through online store. As of July 31, 2022, it operated 1,444 stores. The company was formerly known as Dollarama Capital Corporation and changed its name to Dollarama Inc. in September 2009. Dollarama Inc. was founded in 1992 and is headquartered in Montreal, Canada.
| Metric | 2024 | 2023 | 2022 | 2021 | 2020 | 2019 | 2018 | 2017 | 2016 | 2015 | 2014 | 2013 | 2012 | 2011 | 2010 | 2009 |
|---|---|---|---|---|---|---|---|---|---|---|---|---|---|---|---|---|
| Revenue | 5.87B | 5.05B | 4.33B | 4.03B | 3.79B | 3.55B | 3.27B | 2.96B | 2.65B | 2.33B | 2.06B | 1.86B | 1.60B | 1.42B | 1.25B | 1.09B |
| Cost of Revenue | 3.25B | 3.17B | 2.69B | 2.56B | 2.38B | 2.16B | 2.03B | 1.91B | 1.74B | 1.47B | 1.30B | 1.16B | 1.00B | 906.98M | 810.62M | 724.16M |
| Gross Profit | 2.61B | 1.89B | 1.64B | 1.47B | 1.41B | 1.39B | 1.23B | 1.06B | 908.53M | 859.55M | 765.58M | 694.84M | 600.34M | 512.93M | 443.08M | 364.85M |
| Gross Profit Ratio | 44.54% | 37.31% | 37.96% | 36.43% | 37.19% | 39.20% | 37.79% | 35.68% | 34.28% | 36.88% | 37.08% | 37.38% | 37.46% | 36.12% | 35.34% | 33.50% |
| Research & Development | 0.00 | 0.00 | 0.00 | 0.00 | 0.00 | 0.00 | 0.00 | 0.00 | 0.00 | 0.00 | 0.00 | 0.00 | 0.00 | 0.00 | 0.00 | 0.00 |
| General & Administrative | 844.87M | 720.31M | 652.83M | 654.03M | 551.70M | 505.42M | 474.81M | 458.03M | 435.82M | 398.68M | 363.18M | 339.66M | 305.12M | 0.00 | 0.00 | 0.00 |
| Selling & Marketing | 0.00 | 0.00 | 0.00 | 0.00 | 0.00 | 0.00 | 0.00 | 0.00 | 0.00 | 0.00 | 0.00 | 0.00 | 0.00 | 0.00 | 0.00 | 0.00 |
| SG&A | 844.87M | 720.31M | 652.83M | 654.03M | 551.70M | 505.42M | 474.81M | 458.03M | 435.82M | 398.68M | 363.18M | 339.66M | 305.12M | 278.95M | 264.78M | 214.60M |
| Other Expenses | 272.85M | 0.00 | 0.00 | 0.00 | 2.84M | 0.00 | 0.00 | 0.00 | 0.00 | 0.00 | 0.00 | 0.00 | -2.25M | -10.18M | 31.11M | 44.79M |
| Operating Expenses | 1.12B | 720.31M | 652.83M | 654.03M | 551.70M | 505.42M | 474.81M | 458.03M | 435.82M | 436.99M | 411.08M | 378.95M | 338.46M | 307.46M | 289.70M | 236.41M |
| Cost & Expenses | 4.37B | 3.89B | 3.34B | 3.21B | 2.93B | 2.66B | 2.51B | 2.36B | 2.18B | 1.91B | 1.71B | 1.54B | 1.34B | 1.21B | 1.10B | 960.57M |
| Interest Income | 22.38M | 11.44M | 0.00 | 0.00 | 0.00 | 0.00 | 0.00 | 0.00 | 0.00 | 0.00 | 0.00 | 0.00 | -2.25M | 0.00 | 0.00 | 0.00 |
| Interest Expense | 167.22M | 115.39M | 91.22M | 95.65M | 100.61M | 94.60M | 39.88M | 33.08M | 21.40M | 19.96M | 11.67M | 9.71M | 14.31M | 24.28M | 82.21M | 86.90M |
| Depreciation & Amortization | 365.45M | 331.79M | 297.96M | 269.63M | 242.79M | 233.38M | 71.03M | 58.27M | 48.67M | 38.31M | 47.90M | 39.28M | 34.57M | 28.51M | 24.92M | 20.72M |
| EBITDA | 1.88B | 1.53B | 1.28B | 1.13B | 1.11B | 1.12B | 830.45M | 657.51M | 521.38M | 459.77M | 401.81M | 354.04M | 294.20M | 223.80M | 209.41M | 105.47M |
| EBITDA Ratio | 32.10% | 29.62% | 29.77% | 26.88% | 29.03% | 31.53% | 25.43% | 22.19% | 19.67% | 19.73% | 19.46% | 19.05% | 18.36% | 15.76% | 16.70% | 9.68% |
| Operating Income | 1.50B | 1.16B | 991.24M | 812.70M | 856.85M | 885.54M | 759.41M | 599.24M | 472.71M | 422.56M | 354.50M | 315.89M | 261.88M | 205.47M | 153.38M | 128.44M |
| Operating Income Ratio | 25.49% | 23.06% | 22.89% | 20.18% | 22.62% | 24.96% | 23.25% | 20.22% | 17.84% | 18.13% | 17.17% | 16.99% | 16.34% | 14.47% | 12.23% | 11.79% |
| Total Other Income/Expenses | -144.84M | -115.39M | -91.22M | -95.65M | -97.77M | -94.60M | -39.88M | 13.19M | 55.27M | -19.96M | -11.67M | -10.84M | -16.56M | -34.46M | -51.10M | -131.69M |
| Income Before Tax | 1.35B | 1.03B | 860.22M | 745.70M | 760.10M | 750.59M | 715.69M | 612.43M | 527.98M | 402.61M | 342.83M | 305.05M | 245.33M | 171.01M | 102.28M | -3.25M |
| Income Before Tax Ratio | 23.02% | 20.40% | 19.86% | 18.52% | 20.07% | 21.15% | 21.91% | 20.67% | 19.92% | 17.27% | 16.60% | 16.41% | 15.31% | 12.04% | 8.16% | -0.30% |
| Income Tax Expense | 340.42M | 274.24M | 230.23M | 201.01M | 206.33M | 205.61M | 196.28M | 166.79M | 142.83M | 107.20M | 92.74M | 84.07M | 71.85M | 54.19M | 29.42M | 12.25M |
| Net Income | 1.01B | 801.86M | 663.17M | 564.35M | 564.04M | 544.99M | 519.41M | 445.64M | 385.15M | 295.41M | 250.09M | 220.99M | 173.47M | 116.83M | 72.86M | -15.50M |
| Net Income Ratio | 17.22% | 15.87% | 15.31% | 14.02% | 14.89% | 15.36% | 15.90% | 15.04% | 14.53% | 12.67% | 12.11% | 11.89% | 10.82% | 8.23% | 5.81% | -1.42% |
| EPS | 3.56 | 2.77 | 2.19 | 1.82 | 1.80 | 1.68 | 1.54 | 1.25 | 1.01 | 0.74 | 0.58 | 0.50 | 0.39 | 0.27 | 0.24 | -0.06 |
| EPS Diluted | 3.56 | 2.76 | 2.18 | 1.81 | 1.78 | 1.66 | 1.52 | 1.24 | 1.00 | 0.74 | 0.58 | 0.49 | 0.38 | 0.26 | 0.23 | -0.06 |
| Weighted Avg Shares Out | 283.84M | 289.41M | 302.96M | 310.74M | 313.91M | 324.46M | 338.25M | 356.99M | 381.81M | 400.01M | 431.03M | 441.96M | 442.10M | 438.92M | 309.07M | 255.46M |
| Weighted Avg Shares Out (Dil) | 284.17M | 291.01M | 304.42M | 312.46M | 317.19M | 328.40M | 342.52M | 360.73M | 385.26M | 401.87M | 432.28M | 451.14M | 453.38M | 452.26M | 318.29M | 255.46M |

Dollarama Inc. (DLMAF) CEO Neil Rossy on Q2 2022 Results - Earnings Call Transcript

Dollarama Announces Election of Directors

Dollarama Inc. (DLMAF) CEO Neil Rossy on Q1 2022 Results - Earnings Call Transcript

Dollarama Confirms Fiscal 2022 First Quarter Results Release Date and Hosting of Virtual Annual Shareholders' Meeting

Dollarama: This Dollar Store Hikes Its Dividend And Share Buyback Program

Dollarama sees sales bounce back as pandemic curbs ease, shares at three-year high

Dollarama Inc. (DLMAF) CEO Neil Rossy on Q4 2021 Results - Earnings Call Transcript

Dollarama's sales fall shy of Wall Street estimates in the fourth quarter

9 International Stocks to Buy for Enhanced Diversification

Dollarama: A Possibility Of Record Profits In 2020
Source: https://incomestatements.info
Category: Stock Reports
