See more : Gentera, S.A.B. de C.V. (CMPRF) Income Statement Analysis – Financial Results
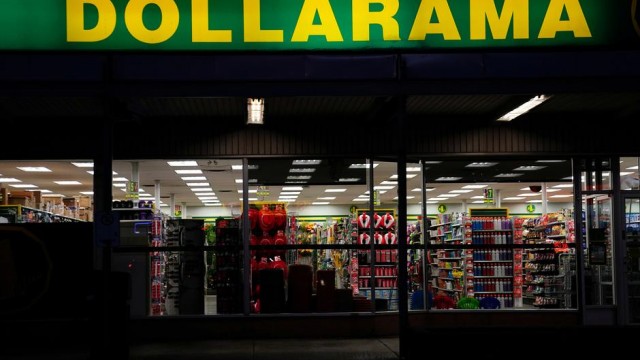
Complete financial analysis of Dollarama Inc. (DLMAF) income statement, including revenue, profit margins, EPS and key performance metrics. Get detailed insights into the financial performance of Dollarama Inc., a leading company in the Discount Stores industry within the Consumer Defensive sector.
- Eco Science Solutions, Inc. (ESSI) Income Statement Analysis – Financial Results
- Fremont Gold Ltd. (FRE.V) Income Statement Analysis – Financial Results
- Hill & Smith Holdings PLC (HILS.L) Income Statement Analysis – Financial Results
- Guoco Group Limited (0053.HK) Income Statement Analysis – Financial Results
- Daiko Tsusan Co.,Ltd. (7673.T) Income Statement Analysis – Financial Results
Dollarama Inc. (DLMAF)
About Dollarama Inc.
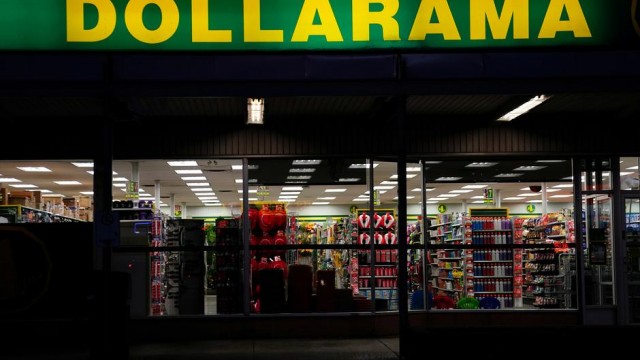
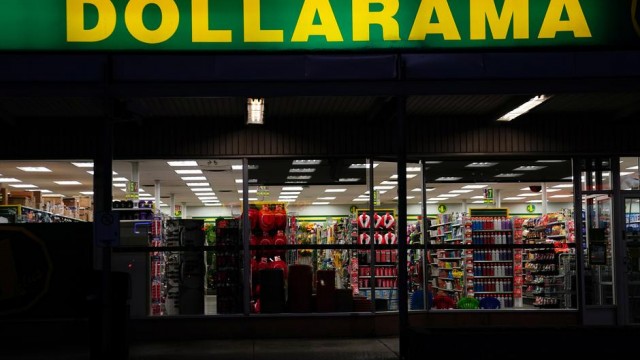
Dollarama Inc. operates a chain of dollar stores in Canada. Its stores offer general merchandise, consumables, and seasonal products. The company also sells its products through online store. As of July 31, 2022, it operated 1,444 stores. The company was formerly known as Dollarama Capital Corporation and changed its name to Dollarama Inc. in September 2009. Dollarama Inc. was founded in 1992 and is headquartered in Montreal, Canada.
| Metric | 2024 | 2023 | 2022 | 2021 | 2020 | 2019 | 2018 | 2017 | 2016 | 2015 | 2014 | 2013 | 2012 | 2011 | 2010 | 2009 |
|---|---|---|---|---|---|---|---|---|---|---|---|---|---|---|---|---|
| Revenue | 5.87B | 5.05B | 4.33B | 4.03B | 3.79B | 3.55B | 3.27B | 2.96B | 2.65B | 2.33B | 2.06B | 1.86B | 1.60B | 1.42B | 1.25B | 1.09B |
| Cost of Revenue | 3.25B | 3.17B | 2.69B | 2.56B | 2.38B | 2.16B | 2.03B | 1.91B | 1.74B | 1.47B | 1.30B | 1.16B | 1.00B | 906.98M | 810.62M | 724.16M |
| Gross Profit | 2.61B | 1.89B | 1.64B | 1.47B | 1.41B | 1.39B | 1.23B | 1.06B | 908.53M | 859.55M | 765.58M | 694.84M | 600.34M | 512.93M | 443.08M | 364.85M |
| Gross Profit Ratio | 44.54% | 37.31% | 37.96% | 36.43% | 37.19% | 39.20% | 37.79% | 35.68% | 34.28% | 36.88% | 37.08% | 37.38% | 37.46% | 36.12% | 35.34% | 33.50% |
| Research & Development | 0.00 | 0.00 | 0.00 | 0.00 | 0.00 | 0.00 | 0.00 | 0.00 | 0.00 | 0.00 | 0.00 | 0.00 | 0.00 | 0.00 | 0.00 | 0.00 |
| General & Administrative | 844.87M | 720.31M | 652.83M | 654.03M | 551.70M | 505.42M | 474.81M | 458.03M | 435.82M | 398.68M | 363.18M | 339.66M | 305.12M | 0.00 | 0.00 | 0.00 |
| Selling & Marketing | 0.00 | 0.00 | 0.00 | 0.00 | 0.00 | 0.00 | 0.00 | 0.00 | 0.00 | 0.00 | 0.00 | 0.00 | 0.00 | 0.00 | 0.00 | 0.00 |
| SG&A | 844.87M | 720.31M | 652.83M | 654.03M | 551.70M | 505.42M | 474.81M | 458.03M | 435.82M | 398.68M | 363.18M | 339.66M | 305.12M | 278.95M | 264.78M | 214.60M |
| Other Expenses | 272.85M | 0.00 | 0.00 | 0.00 | 2.84M | 0.00 | 0.00 | 0.00 | 0.00 | 0.00 | 0.00 | 0.00 | -2.25M | -10.18M | 31.11M | 44.79M |
| Operating Expenses | 1.12B | 720.31M | 652.83M | 654.03M | 551.70M | 505.42M | 474.81M | 458.03M | 435.82M | 436.99M | 411.08M | 378.95M | 338.46M | 307.46M | 289.70M | 236.41M |
| Cost & Expenses | 4.37B | 3.89B | 3.34B | 3.21B | 2.93B | 2.66B | 2.51B | 2.36B | 2.18B | 1.91B | 1.71B | 1.54B | 1.34B | 1.21B | 1.10B | 960.57M |
| Interest Income | 22.38M | 11.44M | 0.00 | 0.00 | 0.00 | 0.00 | 0.00 | 0.00 | 0.00 | 0.00 | 0.00 | 0.00 | -2.25M | 0.00 | 0.00 | 0.00 |
| Interest Expense | 167.22M | 115.39M | 91.22M | 95.65M | 100.61M | 94.60M | 39.88M | 33.08M | 21.40M | 19.96M | 11.67M | 9.71M | 14.31M | 24.28M | 82.21M | 86.90M |
| Depreciation & Amortization | 365.45M | 331.79M | 297.96M | 269.63M | 242.79M | 233.38M | 71.03M | 58.27M | 48.67M | 38.31M | 47.90M | 39.28M | 34.57M | 28.51M | 24.92M | 20.72M |
| EBITDA | 1.88B | 1.53B | 1.28B | 1.13B | 1.11B | 1.12B | 830.45M | 657.51M | 521.38M | 459.77M | 401.81M | 354.04M | 294.20M | 223.80M | 209.41M | 105.47M |
| EBITDA Ratio | 32.10% | 29.62% | 29.77% | 26.88% | 29.03% | 31.53% | 25.43% | 22.19% | 19.67% | 19.73% | 19.46% | 19.05% | 18.36% | 15.76% | 16.70% | 9.68% |
| Operating Income | 1.50B | 1.16B | 991.24M | 812.70M | 856.85M | 885.54M | 759.41M | 599.24M | 472.71M | 422.56M | 354.50M | 315.89M | 261.88M | 205.47M | 153.38M | 128.44M |
| Operating Income Ratio | 25.49% | 23.06% | 22.89% | 20.18% | 22.62% | 24.96% | 23.25% | 20.22% | 17.84% | 18.13% | 17.17% | 16.99% | 16.34% | 14.47% | 12.23% | 11.79% |
| Total Other Income/Expenses | -144.84M | -115.39M | -91.22M | -95.65M | -97.77M | -94.60M | -39.88M | 13.19M | 55.27M | -19.96M | -11.67M | -10.84M | -16.56M | -34.46M | -51.10M | -131.69M |
| Income Before Tax | 1.35B | 1.03B | 860.22M | 745.70M | 760.10M | 750.59M | 715.69M | 612.43M | 527.98M | 402.61M | 342.83M | 305.05M | 245.33M | 171.01M | 102.28M | -3.25M |
| Income Before Tax Ratio | 23.02% | 20.40% | 19.86% | 18.52% | 20.07% | 21.15% | 21.91% | 20.67% | 19.92% | 17.27% | 16.60% | 16.41% | 15.31% | 12.04% | 8.16% | -0.30% |
| Income Tax Expense | 340.42M | 274.24M | 230.23M | 201.01M | 206.33M | 205.61M | 196.28M | 166.79M | 142.83M | 107.20M | 92.74M | 84.07M | 71.85M | 54.19M | 29.42M | 12.25M |
| Net Income | 1.01B | 801.86M | 663.17M | 564.35M | 564.04M | 544.99M | 519.41M | 445.64M | 385.15M | 295.41M | 250.09M | 220.99M | 173.47M | 116.83M | 72.86M | -15.50M |
| Net Income Ratio | 17.22% | 15.87% | 15.31% | 14.02% | 14.89% | 15.36% | 15.90% | 15.04% | 14.53% | 12.67% | 12.11% | 11.89% | 10.82% | 8.23% | 5.81% | -1.42% |
| EPS | 3.56 | 2.77 | 2.19 | 1.82 | 1.80 | 1.68 | 1.54 | 1.25 | 1.01 | 0.74 | 0.58 | 0.50 | 0.39 | 0.27 | 0.24 | -0.06 |
| EPS Diluted | 3.56 | 2.76 | 2.18 | 1.81 | 1.78 | 1.66 | 1.52 | 1.24 | 1.00 | 0.74 | 0.58 | 0.49 | 0.38 | 0.26 | 0.23 | -0.06 |
| Weighted Avg Shares Out | 283.84M | 289.41M | 302.96M | 310.74M | 313.91M | 324.46M | 338.25M | 356.99M | 381.81M | 400.01M | 431.03M | 441.96M | 442.10M | 438.92M | 309.07M | 255.46M |
| Weighted Avg Shares Out (Dil) | 284.17M | 291.01M | 304.42M | 312.46M | 317.19M | 328.40M | 342.52M | 360.73M | 385.26M | 401.87M | 432.28M | 451.14M | 453.38M | 452.26M | 318.29M | 255.46M |

Dollarama lifts annual comparable sales forecast on strong demand

Dollar Tree, Dollarama stocks fall in wake of report of toxic chemicals and lead found in children's products

Dollarama: Hide Here While Inflation Persists

Dollarama Inc.'s (DLMAF) CEO Neil Rossy on Q1 2023 Results - Earnings Call Transcript

Dollarama beats sales estimates on strong demand for consumables

Dollarama: A Jewel To Keep An Eye On

Dollarama Inc. (DLMAF) CEO Neil Rossy on Q4 2022 Results - Earnings Call Transcript

Dollarama to sell products priced up to C$5 to shore up margins

Dollarama: Strong Execution Of The Growth Plans Results In Stronger Margins

Dollarama Inc. (DLMAF) CEO Neil Rossy on Q3 2022 Results - Earnings Call Transcript
Source: https://incomestatements.info
Category: Stock Reports
