See more : Okamura Corporation (OKAMF) Income Statement Analysis – Financial Results
Complete financial analysis of Directa Plus Plc (DTPKF) income statement, including revenue, profit margins, EPS and key performance metrics. Get detailed insights into the financial performance of Directa Plus Plc, a leading company in the Chemicals – Specialty industry within the Basic Materials sector.
- AppHarvest, Inc. (APPHW) Income Statement Analysis – Financial Results
- STL Global Limited (SGL.NS) Income Statement Analysis – Financial Results
- Chesapeake Gold Corp. (CHPGF) Income Statement Analysis – Financial Results
- Shandong Link Science and Technology Co.,Ltd. (001207.SZ) Income Statement Analysis – Financial Results
- SOL S.p.A. (SOL.MI) Income Statement Analysis – Financial Results
Directa Plus Plc (DTPKF)
About Directa Plus Plc
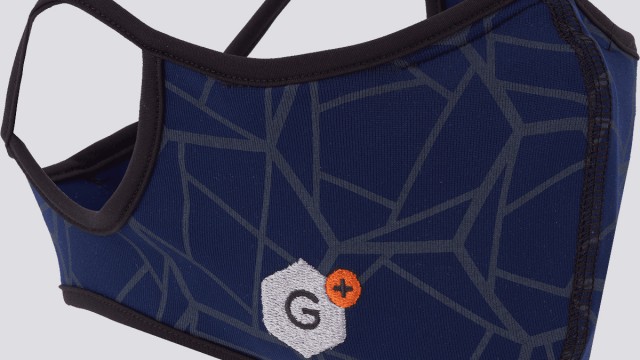
Directa Plus Plc manufactures and sells graphene-based products for industrial and commercial applications in Italy and internationally. It operates through Textile, Environmental, and Others segments. The company offers its products under the G+ brand name. Its products are used in environment, elastomers, textiles, composite materials, golf balls, footwear, and tyre applications. The company was incorporated in 2003 and is based in Lomazzo, Italy.
| Metric | 2023 | 2022 | 2021 | 2020 | 2019 | 2018 | 2017 | 2016 | 2015 | 2014 | 2013 |
|---|---|---|---|---|---|---|---|---|---|---|---|
| Revenue | 10.53M | 10.86M | 8.62M | 6.43M | 2.63M | 2.25M | 952.20K | 738.03K | 1.39M | 101.57K | 65.15K |
| Cost of Revenue | 5.88M | 6.05M | 3.62M | 2.35M | 1.10M | 1.43M | 217.05K | 281.20K | 2.17M | 59.19K | 75.52K |
| Gross Profit | 4.65M | 4.81M | 4.99M | 4.08M | 1.53M | 820.83K | 735.15K | 456.83K | -782.22K | 42.38K | -10.38K |
| Gross Profit Ratio | 44.17% | 44.29% | 57.97% | 63.46% | 58.29% | 36.43% | 77.21% | 61.90% | -56.18% | 41.72% | -15.93% |
| Research & Development | 0.00 | 635.71K | 778.14K | 480.16K | 813.22K | 726.97K | 712.76K | 242.60K | 232.63K | 185.67K | 147.88K |
| General & Administrative | 1.86M | 1.94M | 1.82M | 3.23M | 545.39K | 0.00 | 0.00 | 0.00 | 972.67K | 650.19K | 506.01K |
| Selling & Marketing | 25.11K | 15.72K | 32.99K | 27.87K | 248.20K | 0.00 | 0.00 | 0.00 | 185.14K | 199.28K | 112.73K |
| SG&A | 1.88M | 1.96M | 3.59M | 3.26M | 793.59K | 2.17M | 1.95M | 1.52M | 1.16M | 849.47K | 618.74K |
| Other Expenses | 6.95M | 0.00 | 0.00 | 0.00 | 0.00 | 0.00 | 0.00 | 1.00 | -4.62K | -3.86K | -2.88K |
| Operating Expenses | 8.84M | 9.82M | 8.53M | 8.39M | 5.09M | 4.74M | 4.53M | 5.26M | 2.45M | 1.11M | 1.00M |
| Cost & Expenses | 14.72M | 15.87M | 12.15M | 10.75M | 6.19M | 6.17M | 4.75M | 4.98M | 4.63M | 1.17M | 1.08M |
| Interest Income | 46.11K | 5.90K | 1.62K | 1.18K | 3.99K | 4.44K | 5.50K | 4.23K | 7.03K | 4.47K | 8.11K |
| Interest Expense | 194.66K | 115.77K | 74.68K | 77.44K | 35.97K | 23.47K | 26.40K | 216.36K | 432.11K | 70.16K | 12.43K |
| Depreciation & Amortization | 1.27M | 1.35M | 1.58M | 1.68M | 866.70K | 665.29K | 625.34K | 549.76K | 492.14K | 353.77K | 242.47K |
| EBITDA | -2.84M | -3.81M | -1.77M | -2.89M | -2.55M | -3.26M | -3.29M | -4.58M | -3.44M | -715.88K | -762.55K |
| EBITDA Ratio | -26.99% | -35.08% | -20.51% | -44.90% | -97.02% | -144.59% | -345.10% | -621.22% | -196.57% | -704.82% | -1,170.50% |
| Operating Income | -4.18M | -5.02M | -3.53M | -4.31M | -3.56M | -3.92M | -3.79M | -4.24M | -3.23M | -1.07M | -1.01M |
| Operating Income Ratio | -39.74% | -46.21% | -41.00% | -67.00% | -135.08% | -173.78% | -398.49% | -574.31% | -232.24% | -1,055.90% | -1,554.48% |
| Total Other Income/Expenses | -122.39K | -311.90K | 146.94K | -346.53K | 128.56K | -40.70K | -151.81K | -2.19M | -1.13M | -67.35K | -4.75K |
| Income Before Tax | -4.31M | -5.33M | -3.38M | -4.66M | -3.43M | -3.96M | -3.95M | -6.42M | -4.37M | -1.14M | -1.02M |
| Income Before Tax Ratio | -40.90% | -49.08% | -39.29% | -72.38% | -130.19% | -175.58% | -414.43% | -870.56% | -313.70% | -1,122.20% | -1,561.77% |
| Income Tax Expense | -31.72K | -53.20K | 44.62K | -124.41K | -25.23K | 414.00 | 1.24K | -933.47K | 4.43K | -236.55K | -205.98K |
| Net Income | -3.86M | -4.82M | -3.65M | -4.20M | -3.59M | -3.96M | -3.95M | -6.42M | -4.37M | -900.45K | -803.78K |
| Net Income Ratio | -36.62% | -44.42% | -42.39% | -65.20% | -136.23% | -175.80% | -414.63% | -870.16% | -313.70% | -886.54% | -1,233.80% |
| EPS | -0.06 | -0.07 | -0.06 | -0.07 | -0.07 | -0.09 | -0.09 | -0.19 | -0.10 | -0.02 | -0.02 |
| EPS Diluted | -0.06 | -0.07 | -0.06 | -0.07 | -0.07 | -0.09 | -0.09 | -0.19 | -0.10 | -0.02 | -0.02 |
| Weighted Avg Shares Out | 64.27M | 66.05M | 61.38M | 61.06M | 52.97M | 44.38M | 43.87M | 33.80M | 44.21M | 44.21M | 44.21M |
| Weighted Avg Shares Out (Dil) | 67.05M | 66.05M | 61.38M | 61.06M | 52.97M | 44.38M | 44.21M | 34.47M | 44.21M | 44.21M | 44.21M |

Directa Plus eyes industrial filtration markets as it lands new project

Directa Plus pioneers graphene use as sector evolves

Directa Plus awarded LSE Green Economy Mark

Directa Plus recognised by the Italian Chamber of Commerce as a "rising star"

Directa Plus technology used in new line of high-tech trail shoes

Directa Plus's technology used in new line of high-tech trail shoes

Directa Plus arranges second Italian Covid loan

Directa Plus says decontamination contract reactivated after two-year hiatus

Directa Plus says decontamination contract has been reactivated after two-year hiatus

Directa Plus posts “best results in its history”
Source: https://incomestatements.info
Category: Stock Reports
