See more : Burtech Acquisition Corp. (BRKH) Income Statement Analysis – Financial Results
Complete financial analysis of Airbus SE (EADSF) income statement, including revenue, profit margins, EPS and key performance metrics. Get detailed insights into the financial performance of Airbus SE, a leading company in the Aerospace & Defense industry within the Industrials sector.
- PlantArc Bio Ltd. (PLNT.TA) Income Statement Analysis – Financial Results
- Shell plc (RDSB.L) Income Statement Analysis – Financial Results
- PT Bank Oke Indonesia Tbk (DNAR.JK) Income Statement Analysis – Financial Results
- Navitas Petroleum, Limited Partnership (NVPT.TA) Income Statement Analysis – Financial Results
- Jiangsu Hengxing New Material (603276.SS) Income Statement Analysis – Financial Results
Airbus SE (EADSF)
About Airbus SE
Airbus SE engages in the designing, manufacturing, and delivering aerospace products, services, and solutions worldwide. It operates through three segments: Airbus, Airbus Helicopters, and Airbus Defence and Space. The Airbus segment develops, manufactures, markets, and sells commercial jet aircraft of approximately 100 seats; and regional turboprop aircraft and aircraft components, as well as provides aircraft conversion and related services. The Airbus Helicopters segment engages in the development, manufacturing, marketing, and sale of civil and military helicopters; and provision of helicopter related services. The Airbus Defence and Space segment designs, develops, delivers, and supports military aircraft, such as combat, mission, transport, tanker aircraft, and their associated services; and offers unmanned aerial systems. This segment also offers civil and defense space systems for telecommunications, earth observations, navigation, science, and orbital systems; missile systems; and space launcher systems, as well as services around data processing from platforms, secure communication, and cyber security. The company was formerly known as Airbus Group SE and changed its name to Airbus SE in April 2017. Airbus SE was incorporated in 1998 and is based in Leiden, the Netherlands.
| Metric | 2023 | 2022 | 2021 | 2020 | 2019 | 2018 | 2017 | 2016 | 2015 | 2014 | 2013 | 2012 | 2011 | 2010 | 2009 | 2008 | 2007 | 2006 | 2005 | 2004 | 2003 | 2002 |
|---|---|---|---|---|---|---|---|---|---|---|---|---|---|---|---|---|---|---|---|---|---|---|
| Revenue | 65.45B | 58.76B | 52.15B | 49.91B | 70.48B | 63.71B | 66.77B | 66.58B | 64.45B | 60.71B | 59.26B | 56.48B | 49.13B | 45.75B | 42.82B | 43.27B | 39.12B | 39.43B | 34.21B | 31.76B | 30.13B | 29.90B |
| Cost of Revenue | 55.40B | 48.19B | 42.52B | 44.25B | 59.97B | 54.92B | 59.16B | 61.32B | 55.60B | 51.78B | 50.90B | 48.55B | 42.29B | 39.53B | 38.38B | 35.91B | 34.80B | 34.72B | 27.53B | 25.51B | 24.59B | 24.47B |
| Gross Profit | 10.04B | 10.57B | 9.63B | 5.66B | 10.51B | 8.79B | 7.61B | 5.26B | 8.85B | 8.94B | 8.36B | 7.94B | 6.84B | 6.22B | 4.44B | 7.36B | 4.32B | 4.71B | 6.68B | 6.25B | 5.54B | 5.44B |
| Gross Profit Ratio | 15.35% | 17.99% | 18.47% | 11.34% | 14.91% | 13.79% | 11.39% | 7.91% | 13.73% | 14.72% | 14.11% | 14.05% | 13.93% | 13.60% | 10.37% | 17.01% | 11.04% | 11.95% | 19.52% | 19.68% | 18.38% | 18.18% |
| Research & Development | 3.42B | 3.08B | 2.75B | 2.86B | 3.36B | 3.22B | 2.81B | 2.97B | 3.46B | 3.39B | 3.16B | 3.14B | 3.15B | 2.94B | 2.83B | 2.67B | 2.61B | 2.46B | 2.08B | 2.13B | 2.19B | 2.10B |
| General & Administrative | 1.65B | 1.45B | 1.34B | 1.42B | 5.22B | 1.57B | 1.57B | 1.73B | 1.59B | 1.54B | 1.70B | 1.67B | 1.43B | 1.29B | 1.27B | 1.25B | 2.28B | 2.46B | 2.34B | 1.32B | 1.39B | 1.42B |
| Selling & Marketing | 867.00M | 788.00M | 713.00M | 717.00M | 908.00M | 861.00M | 872.00M | 997.00M | 1.07B | 1.06B | 1.22B | 1.19B | 981.00M | 1.02B | 924.00M | 933.00M | 864.00M | 0.00 | 0.00 | 798.00M | 776.00M | 829.00M |
| SG&A | 2.52B | 2.24B | 2.05B | 2.14B | 6.13B | 2.44B | 2.44B | 2.72B | 2.65B | 2.60B | 2.91B | 2.86B | 2.41B | 2.31B | 2.20B | 2.19B | 2.28B | 2.46B | 2.34B | 2.12B | 2.16B | 2.25B |
| Other Expenses | 0.00 | -119.00M | 393.00M | -1.33B | 14.00M | 1.47B | 41.00M | 246.00M | 252.00M | 220.00M | 187.00M | 168.00M | 138.00M | 137.00M | 0.00 | 0.00 | 0.00 | 0.00 | 0.00 | 0.00 | 0.00 | 0.00 |
| Operating Expenses | 5.94B | 5.32B | 4.80B | 5.00B | 9.48B | 5.65B | 5.25B | 5.69B | 6.11B | 6.15B | 6.31B | 6.21B | 5.56B | 5.04B | 4.82B | 4.59B | 4.35B | 4.43B | 3.96B | 4.11B | 4.98B | 5.28B |
| Cost & Expenses | 61.34B | 53.51B | 47.32B | 49.25B | 69.46B | 60.57B | 64.41B | 67.01B | 61.71B | 57.93B | 57.21B | 54.76B | 47.85B | 44.57B | 43.20B | 40.49B | 39.16B | 39.16B | 31.49B | 29.62B | 29.57B | 29.74B |
| Interest Income | 728.00M | 188.00M | 88.00M | 140.00M | 228.00M | 208.00M | 189.00M | 247.00M | 183.00M | 142.00M | 168.00M | 237.00M | 377.00M | 316.00M | 801.00M | 617.00M | 502.00M | 454.00M | 0.00 | 84.00M | 186.00M | 87.00M |
| Interest Expense | 753.00M | 412.00M | 353.00M | 436.00M | 385.00M | 440.00M | 517.00M | 522.00M | 551.00M | 462.00M | 497.00M | 522.00M | 364.00M | 415.00M | 503.00M | 581.00M | 701.00M | 244.00M | 177.00M | 275.00M | 203.00M | 81.00M |
| Depreciation & Amortization | 1.86B | 2.72B | 2.33B | 2.83B | 2.93B | 2.44B | 2.30B | 2.29B | 2.47B | 2.15B | 1.97B | 2.05B | 1.88B | 1.58B | 1.83B | 1.67B | 1.77B | 1.69B | 1.65B | 1.62B | 2.38B | 2.77B |
| EBITDA | 6.13B | 8.20B | 7.71B | 2.14B | 4.38B | 7.51B | 6.41B | 2.29B | 6.51B | 5.74B | 4.38B | 4.21B | 3.57B | 2.81B | 1.36B | 4.55B | 1.70B | 1.97B | 4.37B | 3.79B | 3.27B | 3.04B |
| EBITDA Ratio | 9.36% | 14.55% | 15.48% | 4.06% | 6.11% | 11.79% | 9.60% | 3.44% | 10.10% | 9.45% | 7.52% | 7.53% | 7.41% | 6.15% | 3.17% | 10.51% | 4.35% | 4.99% | 12.76% | 11.94% | 10.85% | 10.15% |
| Operating Income | 4.10B | 5.83B | 5.75B | -805.00M | 1.38B | 5.07B | 4.11B | -6.00M | 4.05B | 3.59B | 2.49B | 2.20B | 1.76B | 1.23B | -469.00M | 2.88B | -69.00M | 278.00M | 2.71B | 2.17B | 895.00M | 268.00M |
| Operating Income Ratio | 6.27% | 9.93% | 11.03% | -1.61% | 1.96% | 7.95% | 6.16% | -0.01% | 6.28% | 5.91% | 4.20% | 3.90% | 3.58% | 2.69% | -1.10% | 6.66% | -0.18% | 0.70% | 7.93% | 6.84% | 2.97% | 0.90% |
| Total Other Income/Expenses | 667.00M | 333.00M | 300.00M | -1.13B | 42.00M | -780.00M | 460.00M | 1.93B | -670.00M | -374.00M | -513.00M | -564.00M | -364.00M | -63.00M | -503.00M | -472.00M | -701.00M | -244.00M | -177.00M | -287.00M | -203.00M | -81.00M |
| Income Before Tax | 4.77B | 5.08B | 5.03B | -1.13B | 1.06B | 4.29B | 4.57B | 1.29B | 3.38B | 3.21B | 1.98B | 1.68B | 1.39B | 816.00M | -972.00M | 2.30B | -770.00M | 34.00M | 2.54B | 1.90B | 692.00M | 187.00M |
| Income Before Tax Ratio | 7.29% | 8.64% | 9.64% | -2.26% | 1.51% | 6.73% | 6.84% | 1.94% | 5.24% | 5.29% | 3.34% | 2.97% | 2.84% | 1.78% | -2.27% | 5.32% | -1.97% | 0.09% | 7.41% | 5.97% | 2.30% | 0.63% |
| Income Tax Expense | 1.16B | 939.00M | 853.00M | 39.00M | 2.39B | 1.27B | 1.69B | 291.00M | 677.00M | 863.00M | 502.00M | 449.00M | 356.00M | 244.00M | -220.00M | 703.00M | -333.00M | -81.00M | 825.00M | 664.00M | 474.00M | 453.00M |
| Net Income | 3.79B | 4.25B | 4.21B | -1.13B | -1.36B | 3.05B | 2.36B | 995.00M | 2.70B | 2.34B | 1.47B | 1.20B | 980.00M | 553.00M | -752.00M | 1.57B | -437.00M | 99.00M | 1.68B | 1.20B | 218.00M | -266.00M |
| Net Income Ratio | 5.79% | 7.23% | 8.08% | -2.27% | -1.93% | 4.79% | 3.54% | 1.49% | 4.18% | 3.86% | 2.49% | 2.12% | 1.99% | 1.21% | -1.76% | 3.63% | -1.12% | 0.25% | 4.90% | 3.79% | 0.72% | -0.89% |
| EPS | 4.80 | 5.40 | 5.36 | -1.45 | -1.75 | 3.94 | 3.05 | 1.29 | 3.43 | 2.99 | 1.86 | 1.46 | 1.21 | 0.68 | -0.93 | 1.95 | -0.54 | 0.12 | 2.11 | 1.50 | 0.27 | -0.33 |
| EPS Diluted | 4.80 | 5.39 | 5.36 | -1.45 | -1.75 | 3.91 | 3.04 | 1.29 | 3.42 | 2.99 | 1.85 | 1.46 | 1.20 | 0.68 | -0.93 | 1.95 | -0.54 | 0.12 | 2.09 | 1.50 | 0.27 | -0.33 |
| Weighted Avg Shares Out | 788.72M | 787.08M | 785.33M | 783.18M | 777.04M | 775.17M | 773.77M | 773.80M | 785.62M | 782.96M | 792.47M | 819.38M | 812.51M | 810.69M | 809.70M | 806.98M | 803.13M | 800.19M | 794.73M | 801.04M | 800.96M | 804.12M |
| Weighted Avg Shares Out (Dil) | 789.76M | 787.75M | 785.90M | 783.18M | 777.04M | 780.94M | 779.30M | 779.11M | 788.49M | 784.16M | 794.13M | 820.55M | 813.70M | 810.94M | 809.70M | 806.98M | 805.55M | 804.32M | 800.22M | 804.08M | 800.96M | 804.12M |
Airbus CEO upbeat on new engine technology, but jury still out
Airbus Delivery Slowdown: Supply Chain Struggles And Order Analysis
Airbus posts lower deliveries, wins bumper order from private customer
EU orders Airbus A350 inspections after Cathay engine fire
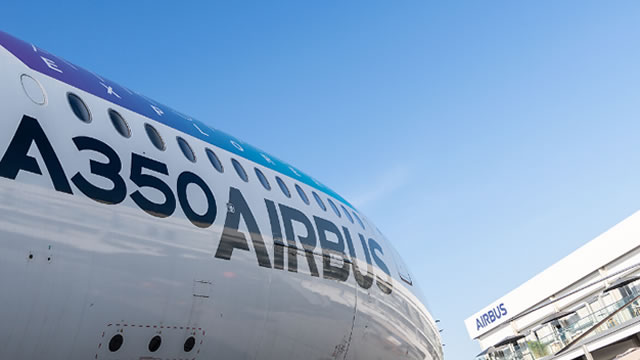
Part of Airbus A350 fleet faces inspection, regulator says

What are airlines doing in response to Cathay Pacific's Airbus A350 engine failure
Airbus, Rolls to brief airlines as pressure for A350 checks eases
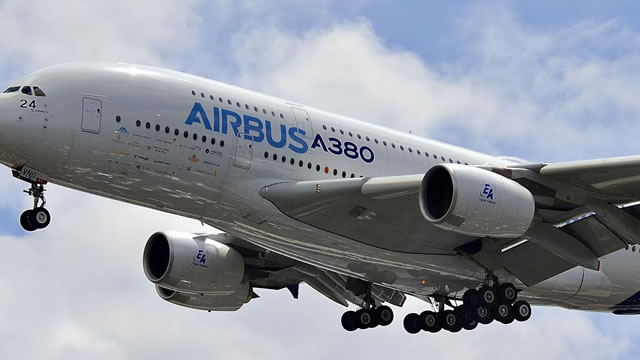
Swiss International forced to add huge 'balancing plate' to Airbus jets due to new 1st-class seat weight
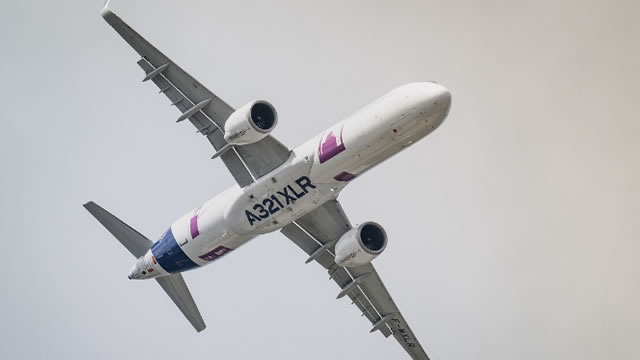
Cathay says 15 Airbus planes need new engine parts after fleet-wide inspections
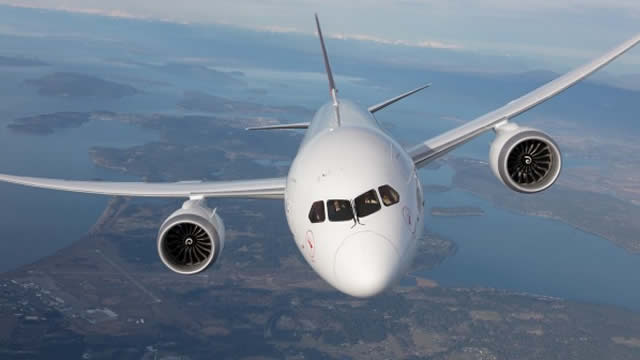
Cathay Pacific Airbus A350 engine part failure: What you need to know
Source: https://incomestatements.info
Category: Stock Reports
