See more : Sonalis Consumer Products Limi (SONALIS.BO) Income Statement Analysis – Financial Results
Complete financial analysis of Eagle Point Credit Company Inc. (ECCB) income statement, including revenue, profit margins, EPS and key performance metrics. Get detailed insights into the financial performance of Eagle Point Credit Company Inc., a leading company in the Asset Management industry within the Financial Services sector.
- China Eastern Airlines Corporation Limited (0670.HK) Income Statement Analysis – Financial Results
- Western Superconducting Technologies Co., Ltd. (688122.SS) Income Statement Analysis – Financial Results
- Dhampur Sugar Mills Limited (DHAMPURSUG.NS) Income Statement Analysis – Financial Results
- Luxi Chemical Group Co., Ltd. (000830.SZ) Income Statement Analysis – Financial Results
- Anchorstone Holdings Limited (1592.HK) Income Statement Analysis – Financial Results
Eagle Point Credit Company Inc. (ECCB)
Industry: Asset Management
Sector: Financial Services
About Eagle Point Credit Company Inc.
Eagle Point Credit Company Inc. is a closed ended fund launched and managed by Eagle Point Credit Management LLC. It invests in fixed income markets of the United States. The fund invests equity and junior debt tranches of collateralized loan obligations consisting primarily of below investment grade U.S. senior secured loans. Eagle Point Credit Company Inc. was formed on March 24, 2014 and is domiciled in the United States.
| Metric | 2023 | 2022 | 2021 | 2020 | 2019 | 2018 | 2017 | 2016 | 2015 | 2014 |
|---|---|---|---|---|---|---|---|---|---|---|
| Revenue | 139.07M | -92.73M | 140.84M | 64.06M | -5.37M | -49.60M | 35.10M | 57.76M | 42.35M | 23.00M |
| Cost of Revenue | 0.00 | 27.14M | 21.18M | 15.02M | 16.60M | 17.77M | 16.32M | 13.61M | 0.00 | 0.00 |
| Gross Profit | 139.07M | -119.87M | 119.66M | 49.04M | -21.97M | -67.37M | 18.78M | 44.14M | 42.35M | 23.00M |
| Gross Profit Ratio | 100.00% | 129.27% | 84.96% | 76.55% | 408.95% | 135.83% | 53.51% | 76.43% | 100.00% | 100.00% |
| Research & Development | 0.00 | -0.85 | 1.44 | 2.29 | -0.15 | -0.76 | 0.46 | 1.58 | 0.00 | 0.00 |
| General & Administrative | 37.92M | 7.23M | 6.83M | 3.18M | 3.33M | 5.46M | 3.20M | 15.36M | 13.20M | 2.40M |
| Selling & Marketing | 0.00 | 0.00 | 0.00 | 0.00 | 0.00 | 0.00 | 0.00 | -15.36M | 0.00 | 0.00 |
| SG&A | 37.92M | 7.23M | 6.83M | 3.18M | 3.33M | 5.46M | 3.20M | 1.57 | 13.20M | 2.40M |
| Other Expenses | 0.00 | 1.85M | 2.15M | -6.52K | -7.22K | -213.56K | 760.20K | -7.94M | 0.00 | 0.00 |
| Operating Expenses | 37.92M | 9.08M | 8.98M | 3.17M | 3.32M | 5.25M | 3.96M | 42.68M | 80.79M | 14.65M |
| Cost & Expenses | 37.92M | 9.08M | 8.98M | 3.17M | 3.32M | 5.25M | 3.96M | 42.68M | 80.79M | 14.65M |
| Interest Income | 131.72M | 111.04M | 81.88M | 58.54M | 61.59M | 65.20M | 60.92M | 7.94M | 2.52M | 0.00 |
| Interest Expense | 13.63M | 14.13M | 14.47M | 10.50M | 13.46M | 14.80M | 12.93M | 0.00 | 0.00 | 0.00 |
| Depreciation & Amortization | 31.23M | 206.02M | -55.21M | -43.96M | 67.17M | 125.11M | 36.74M | -33.21M | -28.59M | -20.60M |
| EBITDA | 132.38M | -87.68M | 0.00 | 0.00 | -8.69M | -40.05M | 44.06M | 51.27M | 0.00 | 0.00 |
| EBITDA Ratio | 95.19% | 94.56% | 93.62% | 95.05% | 161.79% | 80.75% | 125.54% | 88.77% | -164.23% | -53.29% |
| Operating Income | 101.15M | -87.68M | 131.86M | 60.89M | -8.69M | -40.05M | 44.06M | 39.31M | 28.59M | 20.60M |
| Operating Income Ratio | 72.73% | 94.56% | 93.62% | 95.05% | 161.79% | 80.75% | 125.54% | 68.06% | 67.51% | 89.57% |
| Total Other Income/Expenses | 17.60M | -14.13M | 0.00 | 0.00 | 0.00 | -14.80M | 16.32M | -384.79K | -69.54M | -12.25M |
| Income Before Tax | 118.75M | -101.81M | 131.86M | 60.89M | -8.69M | -54.85M | 31.13M | 90.58M | -40.96M | 8.34M |
| Income Before Tax Ratio | 85.39% | 109.79% | 93.62% | 95.05% | 161.79% | 110.58% | 88.70% | 156.83% | -96.72% | 36.29% |
| Income Tax Expense | 0.00 | 82.99M | 150.00K | 36.48M | 33.71M | -161.14K | 44.82M | 98.90M | -69.54M | -12.25M |
| Net Income | 116.89M | -101.81M | 131.86M | 60.89M | -8.69M | -54.85M | 31.13M | 90.96M | -40.96M | 8.34M |
| Net Income Ratio | 84.05% | 109.79% | 93.62% | 95.05% | 161.79% | 110.58% | 88.70% | 157.50% | -96.72% | 36.29% |
| EPS | 1.52 | -2.17 | 3.51 | 1.88 | -0.30 | -2.37 | 1.76 | 15.11M | -2.96 | 1.02 |
| EPS Diluted | 1.52 | -2.17 | 3.51 | 1.88 | -0.30 | -2.27 | 1.76 | 15.11M | -2.96 | 1.02 |
| Weighted Avg Shares Out | 76.95M | 46.89M | 37.53M | 32.35M | 28.63M | 23.15M | 17.69M | 6.02 | 13.82M | 8.16M |
| Weighted Avg Shares Out (Dil) | 76.95M | 46.89M | 37.53M | 32.35M | 28.63M | 24.16M | 17.69M | 6.02 | 13.82M | 8.16M |
The Chemist's Quality Closed-End Fund Report: August 2020
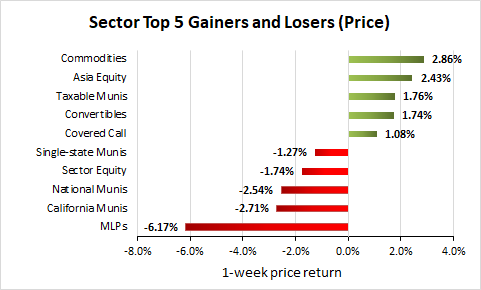
Weekly Closed-End Fund Roundup: August 30, 2020
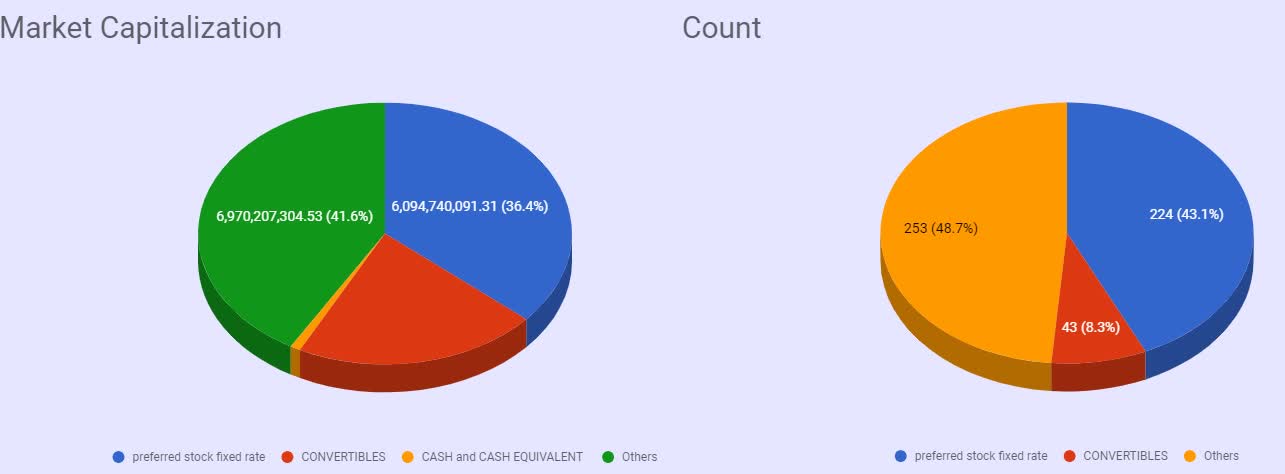
Fixed-Rate Preferred Stocks - Complete Review
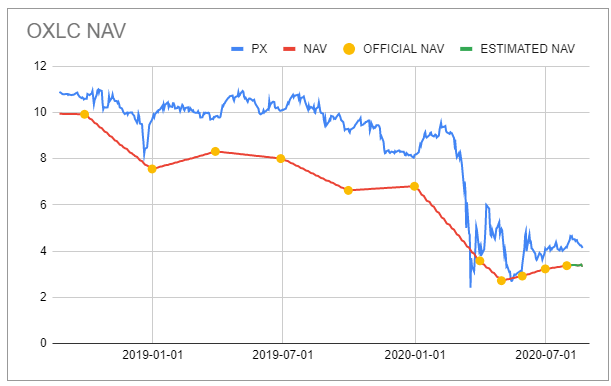
What We Hold Across The CLO Equity Capital Structures
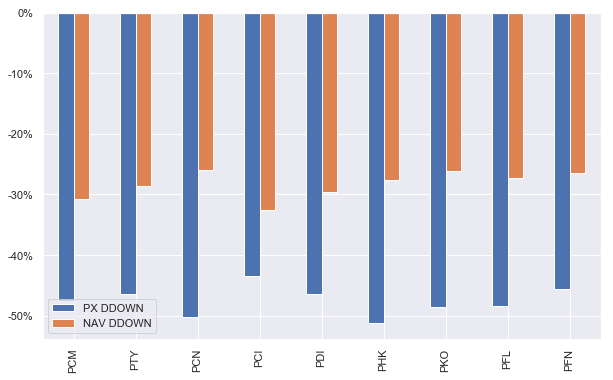
How To Get CEF Yields Without CEF Problems

Eagle Point Credit Company Inc. (ECC) CEO Tom Majewski on Q2 2020 Results - Earnings Call Transcript

Eagle Point Credit Company Inc. Announces Second Quarter 2020 Financial Results

Eagle Point Credit Company Inc. Announces Fourth Quarter 2020 Common and Preferred Distributions

Eagle Point Credit Company Inc. Schedules Release of Second Quarter 2020 Financial Results on Monday, August 17, 2020
The Chemist's Closed-End Fund Report: July 2020
Source: https://incomestatements.info
Category: Stock Reports
