See more : Great American Bancorp, Inc. (GTPS) Income Statement Analysis – Financial Results
Complete financial analysis of Eagle Point Credit Company Inc. (ECCB) income statement, including revenue, profit margins, EPS and key performance metrics. Get detailed insights into the financial performance of Eagle Point Credit Company Inc., a leading company in the Asset Management industry within the Financial Services sector.
- Asante Incorporated (6073.T) Income Statement Analysis – Financial Results
- Glen Eagle Resources Inc. (GERFF) Income Statement Analysis – Financial Results
- Perseus Mining Limited (PRU.AX) Income Statement Analysis – Financial Results
- DCX Systems Limited (DCXINDIA.NS) Income Statement Analysis – Financial Results
- Maj Invest Value Aktier Akk (MAJVAA.CO) Income Statement Analysis – Financial Results
Eagle Point Credit Company Inc. (ECCB)
Industry: Asset Management
Sector: Financial Services
About Eagle Point Credit Company Inc.
Eagle Point Credit Company Inc. is a closed ended fund launched and managed by Eagle Point Credit Management LLC. It invests in fixed income markets of the United States. The fund invests equity and junior debt tranches of collateralized loan obligations consisting primarily of below investment grade U.S. senior secured loans. Eagle Point Credit Company Inc. was formed on March 24, 2014 and is domiciled in the United States.
| Metric | 2023 | 2022 | 2021 | 2020 | 2019 | 2018 | 2017 | 2016 | 2015 | 2014 |
|---|---|---|---|---|---|---|---|---|---|---|
| Revenue | 139.07M | -92.73M | 140.84M | 64.06M | -5.37M | -49.60M | 35.10M | 57.76M | 42.35M | 23.00M |
| Cost of Revenue | 0.00 | 27.14M | 21.18M | 15.02M | 16.60M | 17.77M | 16.32M | 13.61M | 0.00 | 0.00 |
| Gross Profit | 139.07M | -119.87M | 119.66M | 49.04M | -21.97M | -67.37M | 18.78M | 44.14M | 42.35M | 23.00M |
| Gross Profit Ratio | 100.00% | 129.27% | 84.96% | 76.55% | 408.95% | 135.83% | 53.51% | 76.43% | 100.00% | 100.00% |
| Research & Development | 0.00 | -0.85 | 1.44 | 2.29 | -0.15 | -0.76 | 0.46 | 1.58 | 0.00 | 0.00 |
| General & Administrative | 37.92M | 7.23M | 6.83M | 3.18M | 3.33M | 5.46M | 3.20M | 15.36M | 13.20M | 2.40M |
| Selling & Marketing | 0.00 | 0.00 | 0.00 | 0.00 | 0.00 | 0.00 | 0.00 | -15.36M | 0.00 | 0.00 |
| SG&A | 37.92M | 7.23M | 6.83M | 3.18M | 3.33M | 5.46M | 3.20M | 1.57 | 13.20M | 2.40M |
| Other Expenses | 0.00 | 1.85M | 2.15M | -6.52K | -7.22K | -213.56K | 760.20K | -7.94M | 0.00 | 0.00 |
| Operating Expenses | 37.92M | 9.08M | 8.98M | 3.17M | 3.32M | 5.25M | 3.96M | 42.68M | 80.79M | 14.65M |
| Cost & Expenses | 37.92M | 9.08M | 8.98M | 3.17M | 3.32M | 5.25M | 3.96M | 42.68M | 80.79M | 14.65M |
| Interest Income | 131.72M | 111.04M | 81.88M | 58.54M | 61.59M | 65.20M | 60.92M | 7.94M | 2.52M | 0.00 |
| Interest Expense | 13.63M | 14.13M | 14.47M | 10.50M | 13.46M | 14.80M | 12.93M | 0.00 | 0.00 | 0.00 |
| Depreciation & Amortization | 31.23M | 206.02M | -55.21M | -43.96M | 67.17M | 125.11M | 36.74M | -33.21M | -28.59M | -20.60M |
| EBITDA | 132.38M | -87.68M | 0.00 | 0.00 | -8.69M | -40.05M | 44.06M | 51.27M | 0.00 | 0.00 |
| EBITDA Ratio | 95.19% | 94.56% | 93.62% | 95.05% | 161.79% | 80.75% | 125.54% | 88.77% | -164.23% | -53.29% |
| Operating Income | 101.15M | -87.68M | 131.86M | 60.89M | -8.69M | -40.05M | 44.06M | 39.31M | 28.59M | 20.60M |
| Operating Income Ratio | 72.73% | 94.56% | 93.62% | 95.05% | 161.79% | 80.75% | 125.54% | 68.06% | 67.51% | 89.57% |
| Total Other Income/Expenses | 17.60M | -14.13M | 0.00 | 0.00 | 0.00 | -14.80M | 16.32M | -384.79K | -69.54M | -12.25M |
| Income Before Tax | 118.75M | -101.81M | 131.86M | 60.89M | -8.69M | -54.85M | 31.13M | 90.58M | -40.96M | 8.34M |
| Income Before Tax Ratio | 85.39% | 109.79% | 93.62% | 95.05% | 161.79% | 110.58% | 88.70% | 156.83% | -96.72% | 36.29% |
| Income Tax Expense | 0.00 | 82.99M | 150.00K | 36.48M | 33.71M | -161.14K | 44.82M | 98.90M | -69.54M | -12.25M |
| Net Income | 116.89M | -101.81M | 131.86M | 60.89M | -8.69M | -54.85M | 31.13M | 90.96M | -40.96M | 8.34M |
| Net Income Ratio | 84.05% | 109.79% | 93.62% | 95.05% | 161.79% | 110.58% | 88.70% | 157.50% | -96.72% | 36.29% |
| EPS | 1.52 | -2.17 | 3.51 | 1.88 | -0.30 | -2.37 | 1.76 | 15.11M | -2.96 | 1.02 |
| EPS Diluted | 1.52 | -2.17 | 3.51 | 1.88 | -0.30 | -2.27 | 1.76 | 15.11M | -2.96 | 1.02 |
| Weighted Avg Shares Out | 76.95M | 46.89M | 37.53M | 32.35M | 28.63M | 23.15M | 17.69M | 6.02 | 13.82M | 8.16M |
| Weighted Avg Shares Out (Dil) | 76.95M | 46.89M | 37.53M | 32.35M | 28.63M | 24.16M | 17.69M | 6.02 | 13.82M | 8.16M |

Rare 12% Yield And 38% Discount: HFRO
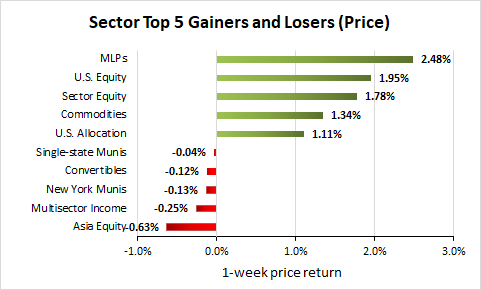
Weekly Closed-End Fund Roundup: July 19, 2020
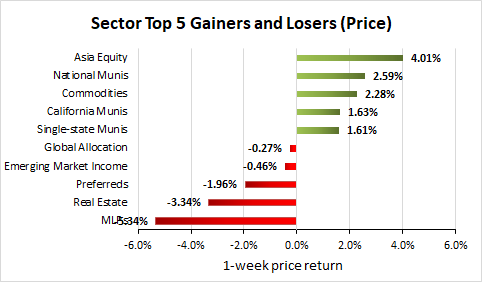
Weekly Closed-End Fund Roundup: TYG/NTG Reinstates Distributions (July 12, 2020)

3-Step Retirement Plan For The Coming Correction
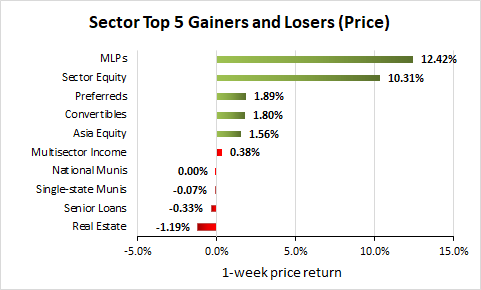
Weekly Closed-End Fund Roundup: June 21, 2020
The Chemist's Quality Closed-End Fund Report: June 2020

Eagle Point Credit Company Inc. Announces First Quarter 2020 Financial Results

Eagle Point Credit Company Inc. Announces Third Quarter 2020 Common and Preferred Distributions and Provides Additional Financial Update

Eagle Point Credit Company Inc. Schedules Release of First Quarter 2020 Financial Results on Thursday, May 21, 2020

Weekly CFO Buys Highlight
Source: https://incomestatements.info
Category: Stock Reports
