See more : EXMceuticals Inc. (EXM.CN) Income Statement Analysis – Financial Results
Complete financial analysis of Empire State Realty OP, L.P. (ESBA) income statement, including revenue, profit margins, EPS and key performance metrics. Get detailed insights into the financial performance of Empire State Realty OP, L.P., a leading company in the REIT – Office industry within the Real Estate sector.
- NASB Financial, Inc. (NASB) Income Statement Analysis – Financial Results
- Georgia Capital PLC (CGEO.L) Income Statement Analysis – Financial Results
- Novacyt S.A. (NVYTF) Income Statement Analysis – Financial Results
- MS Young Adventure Enterprise, Inc. (MSYN) Income Statement Analysis – Financial Results
- BGSF, Inc. (BGSF) Income Statement Analysis – Financial Results
Empire State Realty OP, L.P. (ESBA)
About Empire State Realty OP, L.P.
Empire State Realty OP, L.P. operates as a subsidiary of Empire State Realty Trust, Inc.
| Metric | 2023 | 2022 | 2021 | 2020 | 2019 | 2018 | 2017 | 2016 | 2015 | 2014 | 2013 | 2012 | 2011 | 2010 | 2009 | 2008 |
|---|---|---|---|---|---|---|---|---|---|---|---|---|---|---|---|---|
| Revenue | 739.57M | 727.04M | 624.09M | 609.23M | 731.34M | 731.51M | 712.47M | 678.00M | 657.63M | 635.33M | 311.85M | 260.29M | 294.79M | 246.55M | 232.32M | 268.80M |
| Cost of Revenue | 339.02M | 321.35M | 279.49M | 291.11M | 333.99M | 319.47M | 305.60M | 289.07M | 296.53M | 306.16M | 145.44M | 105.71M | 86.26M | 87.94M | 87.79M | 80.15M |
| Gross Profit | 400.56M | 405.69M | 344.61M | 318.12M | 397.36M | 412.04M | 406.87M | 388.93M | 361.11M | 329.17M | 166.41M | 154.59M | 208.53M | 158.60M | 144.53M | 188.64M |
| Gross Profit Ratio | 54.16% | 55.80% | 55.22% | 52.22% | 54.33% | 56.33% | 57.11% | 57.36% | 54.91% | 51.81% | 53.36% | 59.39% | 70.74% | 64.33% | 62.21% | 70.18% |
| Research & Development | 0.00 | 0.09 | -0.02 | -0.05 | 0.12 | 0.17 | 0.18 | 0.17 | 0.00 | 0.00 | 0.00 | 0.00 | 0.00 | 0.00 | 0.00 | 0.00 |
| General & Administrative | 63.94M | 61.77M | 55.95M | 62.24M | 61.06M | 52.67M | 50.32M | 49.08M | 38.07M | 39.04M | 42.57M | 23.21M | 0.00 | 0.00 | 0.00 | 0.00 |
| Selling & Marketing | 0.00 | 0.00 | 0.00 | 0.00 | 0.00 | 0.00 | 0.00 | 0.00 | 0.00 | 0.00 | 0.00 | 1.30M | 0.00 | 0.00 | 0.00 | 0.00 |
| SG&A | 63.94M | 61.77M | 55.95M | 62.24M | 61.06M | 52.67M | 50.32M | 49.08M | 38.07M | 39.04M | 42.57M | 23.21M | 61.92M | 41.51M | 33.43M | 73.84M |
| Other Expenses | 0.00 | 216.89M | 201.81M | 191.01M | 181.59M | 168.51M | 160.71M | 155.21M | 171.47M | 145.43M | 65.41M | 42.69M | 97.43M | 75.55M | 62.75M | 100.68M |
| Operating Expenses | 253.85M | 278.66M | 257.75M | 253.25M | 242.65M | 221.18M | 211.03M | 204.29M | 209.55M | 184.47M | 107.97M | 65.90M | 97.43M | 75.55M | 62.75M | 100.68M |
| Cost & Expenses | 592.87M | 600.01M | 537.24M | 544.36M | 576.64M | 540.65M | 516.62M | 493.36M | 506.07M | 490.62M | 253.41M | 171.61M | 183.69M | 163.49M | 150.54M | 180.84M |
| Interest Income | 15.14M | 4.95M | 704.00K | 2.64M | 11.26M | 10.66M | 2.94M | 647.00K | 0.00 | 0.00 | 0.00 | 0.00 | 0.00 | 0.00 | 0.00 | 0.00 |
| Interest Expense | 101.48M | 101.21M | 94.39M | 89.91M | 79.25M | 79.62M | 68.47M | 71.15M | 67.49M | 66.46M | 56.96M | 54.39M | 54.75M | 52.26M | 50.74M | 48.66M |
| Depreciation & Amortization | 189.91M | 600.01M | 537.24M | 551.96M | 587.54M | 552.75M | 533.72M | 518.06M | 171.47M | 145.43M | 70.96M | 47.57M | 38.76M | 36.03M | 30.86M | 28.16M |
| EBITDA | 336.62M | 343.92M | 288.66M | 251.05M | 355.38M | 359.37M | 331.62M | 313.94M | 323.04M | 286.75M | 142.05M | 131.38M | 149.86M | 116.29M | 112.64M | 116.12M |
| EBITDA Ratio | 45.52% | 47.98% | 46.37% | 42.43% | 47.52% | 50.58% | 50.05% | 50.13% | 49.12% | 45.67% | 105.38% | 57.86% | 50.83% | 48.30% | 48.48% | 43.20% |
| Operating Income | 146.71M | 127.03M | 79.13M | 58.66M | 154.71M | 190.86M | 195.85M | 184.54M | 151.37M | 141.32M | 58.44M | 88.69M | 111.10M | 83.06M | 81.78M | 87.96M |
| Operating Income Ratio | 19.84% | 17.47% | 12.68% | 9.63% | 21.15% | 26.09% | 27.49% | 27.22% | 23.02% | 22.24% | 18.74% | 34.07% | 37.69% | 33.69% | 35.20% | 32.72% |
| Total Other Income/Expenses | -59.58M | -62.27M | -93.90M | -88.52M | -67.99M | -68.96M | -70.92M | -70.50M | -67.49M | -66.46M | 218.63M | -40.05M | -51.90M | -36.94M | -50.74M | -48.66M |
| Income Before Tax | 87.12M | 64.76M | -14.77M | -29.86M | 86.72M | 121.90M | 124.93M | 113.40M | 83.88M | 74.87M | 200.71M | 48.64M | 56.35M | 30.79M | 31.04M | 39.30M |
| Income Before Tax Ratio | 11.78% | 8.91% | -2.37% | -4.90% | 11.86% | 16.66% | 17.53% | 16.73% | 12.75% | 11.78% | 64.36% | 18.69% | 19.12% | 12.49% | 13.36% | 14.62% |
| Income Tax Expense | 2.72M | 1.55M | -1.73M | -6.97M | 2.43M | 4.64M | 6.67M | 6.15M | 3.95M | 4.66M | 374.39M | 68.74M | -3.89M | -15.32M | -10.80M | -13.42M |
| Net Income | 53.25M | 63.21M | -13.04M | -22.89M | 84.29M | 66.54M | 63.58M | 52.39M | 34.67M | 27.14M | 82.53M | 48.64M | 60.24M | 46.12M | 41.84M | 52.72M |
| Net Income Ratio | 7.20% | 8.69% | -2.09% | -3.76% | 11.53% | 9.10% | 8.92% | 7.73% | 5.27% | 4.27% | 26.46% | 18.69% | 20.44% | 18.71% | 18.01% | 19.61% |
| EPS | 0.50 | 0.38 | -0.08 | -0.13 | 0.47 | 0.38 | 0.40 | 0.38 | 0.30 | 0.27 | 0.79 | 0.53 | 0.66 | 0.49 | 0.46 | 0.58 |
| EPS Diluted | 0.30 | 0.23 | -0.05 | -0.08 | 0.29 | 0.22 | 0.39 | 0.38 | 0.29 | 0.27 | 0.79 | 0.53 | 0.66 | 0.49 | 0.46 | 0.58 |
| Weighted Avg Shares Out | 161.12M | 165.04M | 172.45M | 175.17M | 178.34M | 173.84M | 158.38M | 133.88M | 114.25M | 97.94M | 95.46M | 91.66M | 91.66M | 91.66M | 91.66M | 91.66M |
| Weighted Avg Shares Out (Dil) | 265.63M | 269.95M | 274.98M | 278.18M | 294.75M | 297.26M | 298.05M | 277.57M | 266.62M | 254.51M | 95.61M | 91.66M | 91.66M | 91.66M | 91.66M | 91.66M |

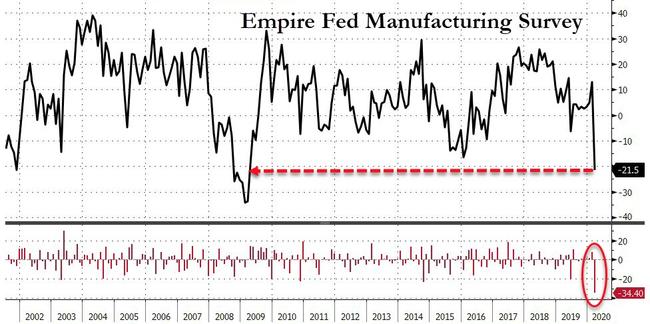
Empire State manufacturing index sees record decline to -21.5 in March

Empire Fed Survey Crashes By Most Ever To 11-Year-Lows

Economic Report: Empire State manufacturing index sees record decline to -21.5 in March

AlphaCrest Capital Management LLC Boosts Stock Holdings in Empire State Realty Trust Inc (NYSE:ESRT)

New York announces 3rd coronavirus death as infections climb in state to 729

<![CDATA[New York bans large gatherings, shuts down Broadway — State of emergency declared in city — Transit ridership tumbles as business braces for impact]]>

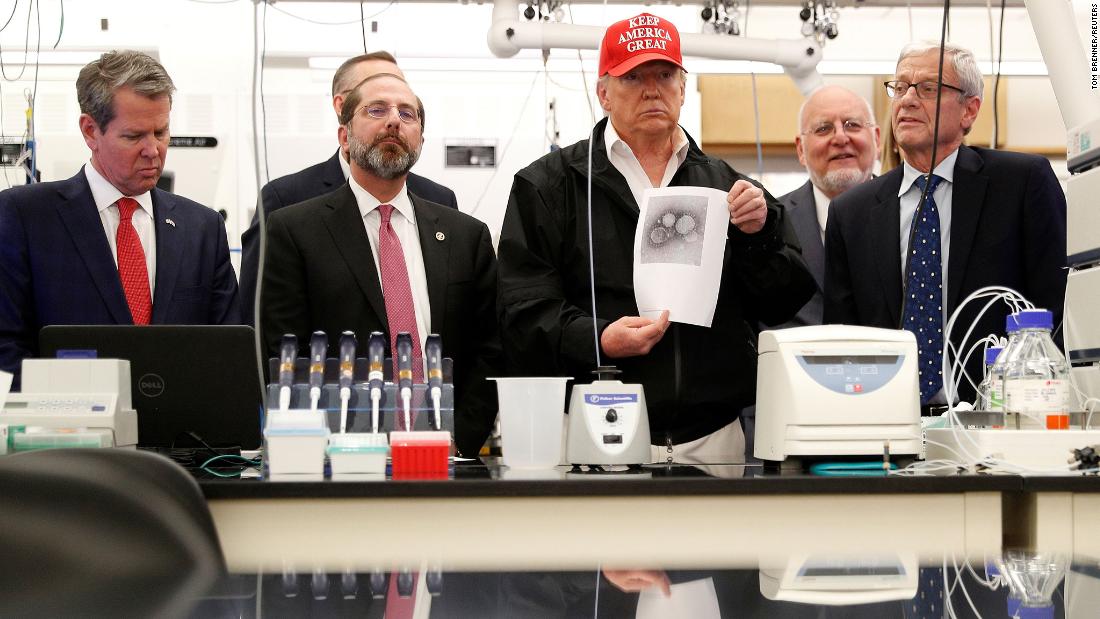
As states struggle to contain coronavirus, Trump gets combative with governors

New York City Fire Department Won't Respond to Coronavirus Emergency Calls

New Jersey cig tax hike could cost the state $47 million | Opinion

Empire State Realty OP LP Unit Series ES (NYSEARCA:ESBA) Plans Quarterly Dividend of $0.11
Source: https://incomestatements.info
Category: Stock Reports
