See more : Hangzhou Tigermed Consulting Co., Ltd. (HNGZY) Income Statement Analysis – Financial Results
Complete financial analysis of Evelo Biosciences, Inc. (EVLO) income statement, including revenue, profit margins, EPS and key performance metrics. Get detailed insights into the financial performance of Evelo Biosciences, Inc., a leading company in the Biotechnology industry within the Healthcare sector.
- Russel Metals Inc. (RUS.TO) Income Statement Analysis – Financial Results
- Storytel AB (publ) (0GBU.L) Income Statement Analysis – Financial Results
- RIV Capital Inc. (CNPOF) Income Statement Analysis – Financial Results
- ENCE Energía y Celulosa, S.A. (ENC.MC) Income Statement Analysis – Financial Results
- Metrics in Balance N.V. (MLMIB.PA) Income Statement Analysis – Financial Results
Evelo Biosciences, Inc. (EVLO)
About Evelo Biosciences, Inc.
Evelo Biosciences, Inc., a biotechnology company, discovers and develops oral biologics for the treatment of inflammatory diseases and cancer. It is developing EDP1815, a whole-microbe candidate for the treatment of inflammatory diseases; and is in Phase 2 clinical trial for the treatment of psoriasis and atopic dermatitis, as well as for the hyperinflammatory response associated with COVID-19. The company also develops EDP1867, an inactivated investigational oral biologic, which is in Phase 1b for the treatment of inflammatory diseases; EDP2939, an extracellular vesicle investigational oral biologic for the treatment of inflammatory diseases; and EDP1908, a product candidate for oncology. Evelo Biosciences, Inc. was incorporated in 2014 and is headquartered in Cambridge, Massachusetts.
| Metric | 2022 | 2021 | 2020 | 2019 | 2018 | 2017 | 2016 |
|---|---|---|---|---|---|---|---|
| Revenue | 0.00 | 0.00 | 0.00 | 0.00 | 0.00 | 0.00 | 0.00 |
| Cost of Revenue | 0.00 | 0.00 | 0.00 | 0.00 | 0.00 | 0.00 | 0.00 |
| Gross Profit | 0.00 | 0.00 | 0.00 | 0.00 | 0.00 | 0.00 | 0.00 |
| Gross Profit Ratio | 0.00% | 0.00% | 0.00% | 0.00% | 0.00% | 0.00% | 0.00% |
| Research & Development | 78.55M | 83.64M | 69.62M | 63.13M | 39.89M | 19.96M | 9.13M |
| General & Administrative | 29.91M | 31.75M | 22.27M | 23.23M | 18.22M | 7.57M | 3.89M |
| Selling & Marketing | 0.00 | 0.00 | 0.00 | 0.00 | 0.00 | 0.00 | 0.00 |
| SG&A | 29.91M | 31.75M | 22.27M | 23.23M | 18.22M | 7.57M | 3.89M |
| Other Expenses | 0.00 | 486.00K | -1.37M | 1.08M | 1.16M | -301.00K | -20.00K |
| Operating Expenses | 108.47M | 115.40M | 91.89M | 86.36M | 58.10M | 27.53M | 13.03M |
| Cost & Expenses | 108.47M | 115.40M | 91.89M | 86.36M | 58.10M | 27.53M | 13.03M |
| Interest Income | 4.67K | 3.61K | 0.00 | 1.05K | 0.00 | 0.00 | 0.00 |
| Interest Expense | 4.67M | 3.61M | 2.11M | 1.05M | 1.56M | 0.00 | 0.00 |
| Depreciation & Amortization | 2.06M | 2.22M | 2.03M | 1.76K | 1.94K | 834.00 | 495.00 |
| EBITDA | -106.35M | -115.40M | -91.89M | -86.36M | -58.10M | -26.70M | -12.53M |
| EBITDA Ratio | 0.00% | 0.00% | 0.00% | 0.00% | 0.00% | 0.00% | 0.00% |
| Operating Income | -108.47M | -115.40M | -91.89M | -86.36M | -58.10M | -27.53M | -13.03M |
| Operating Income Ratio | 0.00% | 0.00% | 0.00% | 0.00% | 0.00% | 0.00% | 0.00% |
| Total Other Income/Expenses | -5.13M | -6.35M | -1.37M | 885.00K | 1.16M | -516.00K | -307.00K |
| Income Before Tax | -113.60M | -121.75M | -93.26M | -85.47M | -56.95M | -28.05M | -13.33M |
| Income Before Tax Ratio | 0.00% | 0.00% | 0.00% | 0.00% | 0.00% | 0.00% | 0.00% |
| Income Tax Expense | 930.00K | 428.00K | 409.00K | 190.00K | -3.09M | 215.00K | 287.00K |
| Net Income | -114.53M | -122.18M | -93.67M | -85.66M | -53.85M | -28.05M | -13.33M |
| Net Income Ratio | 0.00% | 0.00% | 0.00% | 0.00% | 0.00% | 0.00% | 0.00% |
| EPS | -26.28 | -46.18 | -47.45 | -53.49 | -49.25 | -149.98 | -94.55 |
| EPS Diluted | -26.28 | -46.18 | -47.45 | -53.49 | -49.25 | -149.55 | -94.06 |
| Weighted Avg Shares Out | 4.36M | 2.65M | 1.97M | 1.60M | 1.09M | 187.00K | 141.00K |
| Weighted Avg Shares Out (Dil) | 4.36M | 2.65M | 1.97M | 1.60M | 1.09M | 187.54K | 141.74K |

Assessment of the U.S. Renal Cell Carcinoma Market (2016-2025): Market Valuations, Epidemiology, Drugs Sales & Shares, Competitive Landscape

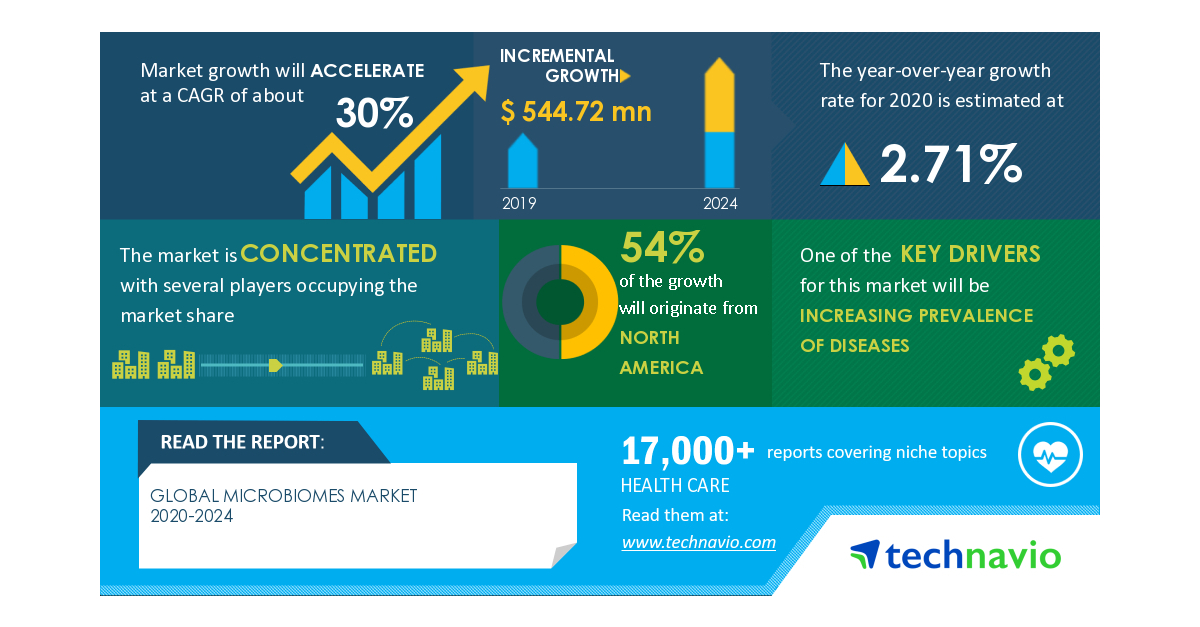
COVID-19 Impact and Recovery Analysis- Microbiomes Market 2020-2024 | Increasing Prevalence Of Diseases to Boost Growth | Technavio

Global Nivolumab Market 2020 Industry Analysis by Key Players, Product Type, Application, Regions and Forecast to 2026

Evelo Biosciences Inc (EVLO) CEO Simba Gill on Q1 2020 Results - Earnings Call Transcript

The Week Ahead In Biotech: Virtual Conference Presentations, Clovis PDUFA Date In The Spotlight

Evelo Biosciences Appoints Neil Graham, M.D., M.B.B.S., M.P.H., as Chief Development Officer

The Daily Biotech Pulse: Roche Obtains FDA Emergency Use Authorization For COVID-19 Test, Chembio Appoints New CEO, Inovio Slumps On Earnings

Flagship Pioneering Announces the Launch of Repertoire Immune Medicines with Industry Veteran John G. Cox as Chief Executive Officer
Source: https://incomestatements.info
Category: Stock Reports


