See more : CGrowth Capital, Inc. (CGRA) Income Statement Analysis – Financial Results
Complete financial analysis of Five Point Holdings, LLC (FPH) income statement, including revenue, profit margins, EPS and key performance metrics. Get detailed insights into the financial performance of Five Point Holdings, LLC, a leading company in the Real Estate – Development industry within the Real Estate sector.
- James Monroe Capital Corporation (JMON) Income Statement Analysis – Financial Results
- Cobram Estate Olives Limited (CBO.AX) Income Statement Analysis – Financial Results
- Toyota Industries Corporation (6201.T) Income Statement Analysis – Financial Results
- Bombay Rayon Fashions Limited (BRFL.NS) Income Statement Analysis – Financial Results
- Adcore Inc. (ADCO.TO) Income Statement Analysis – Financial Results
Five Point Holdings, LLC (FPH)
About Five Point Holdings, LLC
Five Point Holdings, LLC, through its subsidiary, Five Point Operating Company, LP, owns and develops mixed-use and planned communities in Orange County, Los Angeles County, and San Francisco County. The company operates in four segments: Valencia, San Francisco, Great Park, and Commercial. It sells residential and commercial land sites to homebuilders, commercial developers, and commercial buyers; operates and owns a commercial office, medical campus, and other properties; and provides development and property management services. The company was formerly known as Newhall Holding Company, LLC and changed its name to Five Point Holdings, LLC in May 2016. Five Point Holdings, LLC was incorporated in 2009 and is headquartered in Irvine, California.
| Metric | 2023 | 2022 | 2021 | 2020 | 2019 | 2018 | 2017 | 2016 | 2015 | 2014 | 2013 |
|---|---|---|---|---|---|---|---|---|---|---|---|
| Revenue | 211.73M | 42.69M | 224.39M | 153.62M | 184.38M | 48.99M | 139.43M | 39.37M | 35.58M | 78.35M | 89.51M |
| Cost of Revenue | 133.99M | 27.50M | 144.29M | 111.37M | 131.17M | 28.87M | 106.90M | 21.85M | 12.41M | 17.00M | 18.66M |
| Gross Profit | 77.74M | 15.20M | 80.10M | 42.25M | 53.21M | 20.12M | 32.53M | 17.52M | 23.17M | 61.35M | 70.86M |
| Gross Profit Ratio | 36.72% | 35.60% | 35.70% | 27.51% | 28.86% | 41.06% | 23.33% | 44.50% | 65.13% | 78.30% | 79.16% |
| Research & Development | 0.00 | -0.85 | 0.06 | 0.02 | 0.13 | -1.20 | 0.17 | -2.65 | 0.00 | 0.00 | 0.00 |
| General & Administrative | 51.58M | 54.35M | 76.83M | 0.00 | 103.59M | 98.98M | 122.27M | 1.72M | 32.65M | 4.86M | 5.85M |
| Selling & Marketing | 0.00 | 245.00K | 290.00K | 0.00 | 0.00 | 0.00 | 0.00 | 118.95M | -5.11M | 21.83M | 22.58M |
| SG&A | 51.58M | 54.59M | 77.12M | 83.50M | 103.59M | 98.98M | 122.27M | 120.67M | 27.54M | 26.69M | 28.43M |
| Other Expenses | 0.00 | 245.00K | 3.72M | 356.00K | 48.00K | 10.50M | 105.59M | -4.46M | 0.00 | 0.00 | 0.00 |
| Operating Expenses | 51.58M | 54.59M | 77.12M | 83.50M | 103.59M | 98.98M | 122.27M | 120.67M | 27.54M | 26.69M | 28.43M |
| Cost & Expenses | 185.48M | 82.09M | 221.41M | 194.87M | 234.76M | 127.86M | 229.17M | 142.52M | 39.95M | 43.68M | 47.08M |
| Interest Income | 7.23M | 826.00K | 94.00K | 1.37M | 7.84M | 11.77M | 2.58M | 0.00 | 0.00 | 0.00 | 0.00 |
| Interest Expense | 0.00 | 826.00K | 0.00 | 0.00 | 0.00 | 11.77M | 2.58M | 0.00 | 0.00 | 0.00 | 0.00 |
| Depreciation & Amortization | 19.93M | 82.09M | 221.41M | 194.87M | 234.76M | 127.86M | 229.17M | 142.52M | -179.00K | 714.00K | 592.00K |
| EBITDA | 46.10M | -22.20M | 2.98M | -27.11M | -29.74M | -65.61M | -89.74M | -100.11M | -4.37M | 35.38M | 43.02M |
| EBITDA Ratio | 21.77% | -46.74% | 1.33% | -26.85% | -62.50% | -160.99% | -64.36% | -254.29% | -12.28% | 45.16% | 48.06% |
| Operating Income | 26.25M | -36.90M | -23.01M | -55.39M | -135.88M | -78.87M | 89.74M | 103.15M | 4.37M | 34.67M | 42.43M |
| Operating Income Ratio | 12.40% | -86.43% | -10.25% | -36.06% | -73.70% | -160.99% | 64.36% | 262.01% | 12.28% | 44.25% | 47.40% |
| Total Other Income/Expenses | 83.05M | 2.90M | 9.71M | 44.09M | 75.09M | 20.11M | 113.94M | -1.36M | 0.00 | 0.00 | 0.00 |
| Income Before Tax | 109.30M | -36.25M | 12.99M | 2.84M | 24.71M | -58.76M | 24.20M | -104.51M | -4.37M | 34.67M | 42.43M |
| Income Before Tax Ratio | 51.62% | -84.89% | 5.79% | 1.85% | 13.40% | -119.95% | 17.35% | -265.46% | -12.28% | 44.25% | 47.40% |
| Income Tax Expense | -4.42M | -1.47M | -325.00K | 1.74M | 2.45M | 9.18M | -53.12M | -7.89M | -546.00K | 9.17M | 9.82M |
| Net Income | 55.39M | -34.77M | 13.31M | 1.09M | 22.27M | -34.71M | 73.24M | -33.27M | -2.69M | 16.50M | 32.61M |
| Net Income Ratio | 26.16% | -81.45% | 5.93% | 0.71% | 12.08% | -70.86% | 52.52% | -84.50% | -7.55% | 21.05% | 36.43% |
| EPS | 1.53 | -0.24 | 0.20 | 0.02 | 0.15 | -0.53 | 1.33 | -0.88 | -0.07 | 0.45 | 0.89 |
| EPS Diluted | 0.76 | -0.24 | 0.20 | 0.02 | 0.15 | -0.53 | 0.18 | -0.86 | -0.07 | 0.45 | 0.89 |
| Weighted Avg Shares Out | 72.43M | 143.51M | 67.39M | 66.43M | 145.52M | 65.03M | 54.03M | 37.81M | 36.61M | 36.59M | 36.51M |
| Weighted Avg Shares Out (Dil) | 145.15M | 143.51M | 67.39M | 66.72M | 145.52M | 65.03M | 133.03M | 38.48M | 38.48M | 36.59M | 36.51M |

Vinaròs cierra las escuelas de verano al detectarse un positivo entre los monitores

La Fiscalía archiva la denuncia por financiación ilegal contra Vox Valencia al no ver infracción penal

CT Bond Commission releases $4M to fix homes on former Hamden landfill

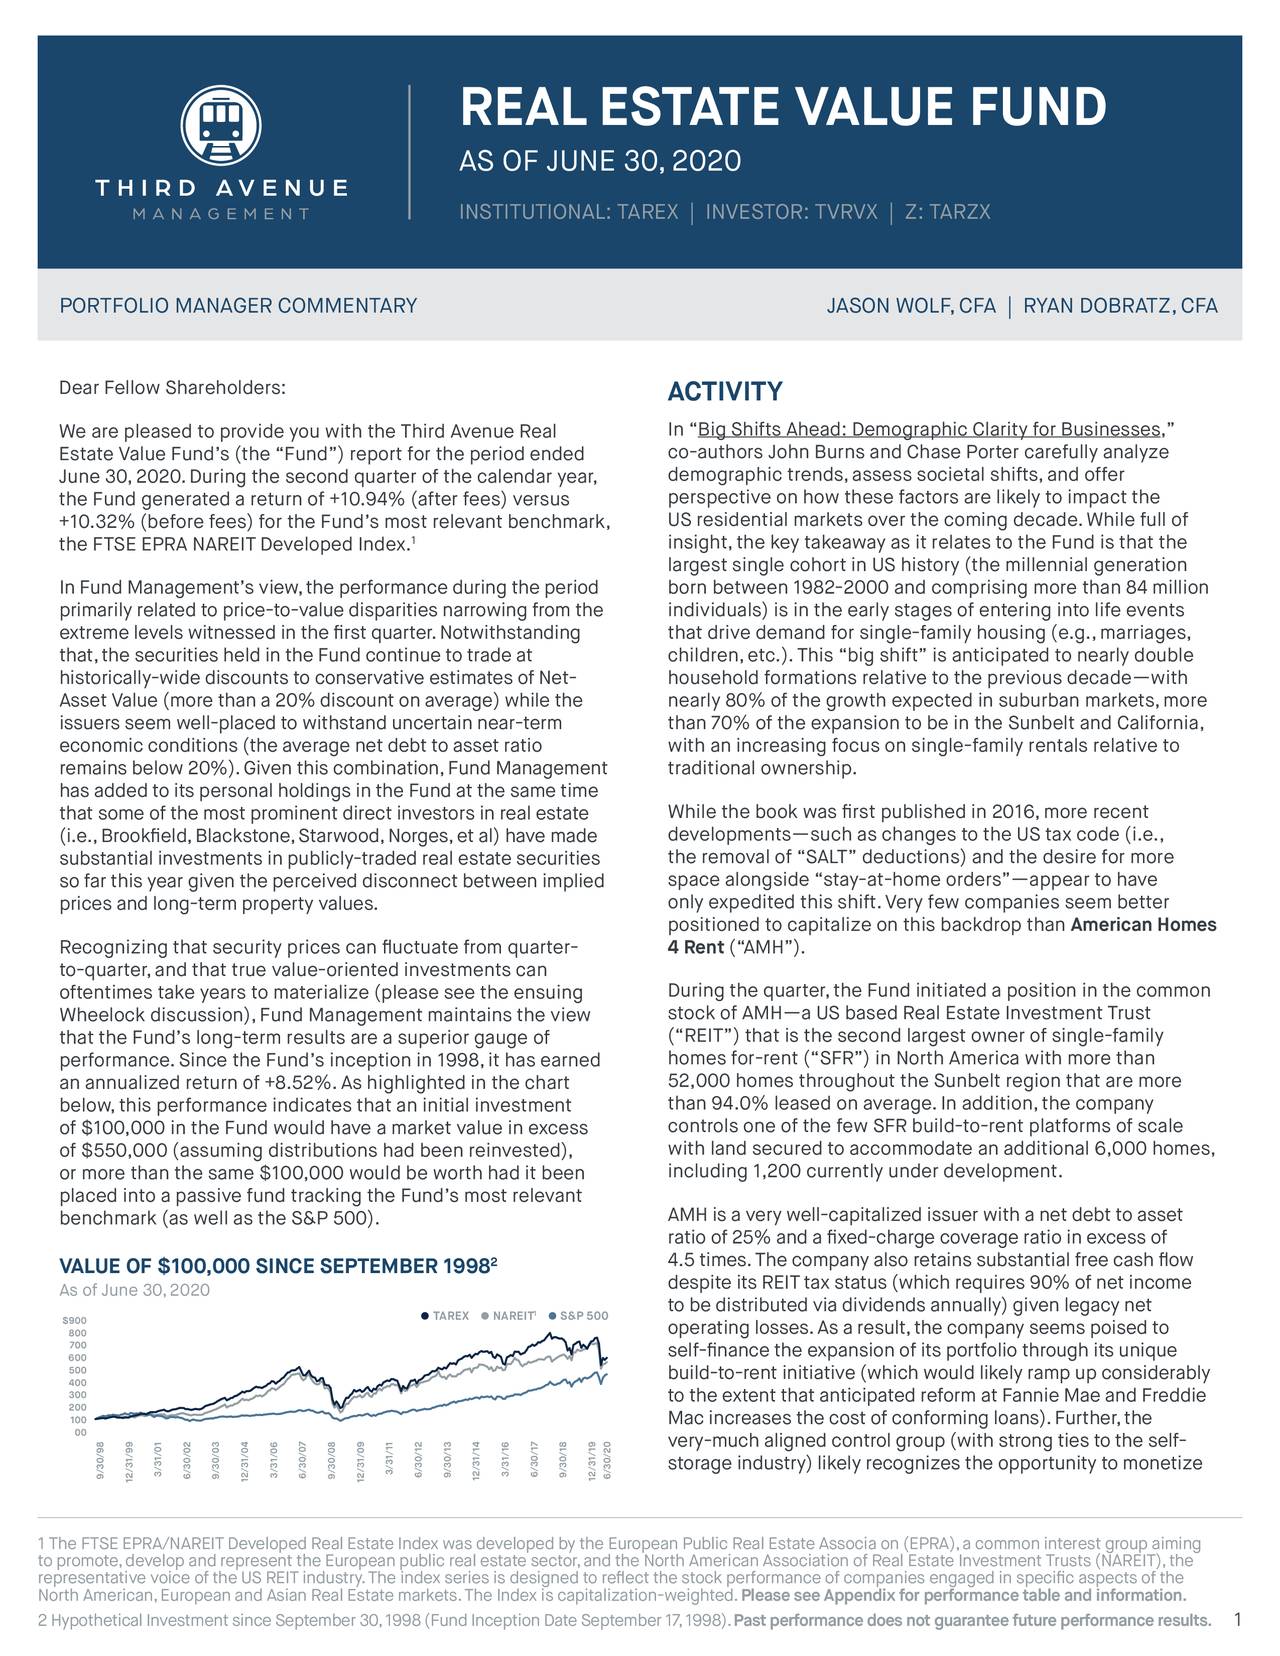
Third Avenue Real Estate Value Fund Portfolio Manager Commentary Q2 2020

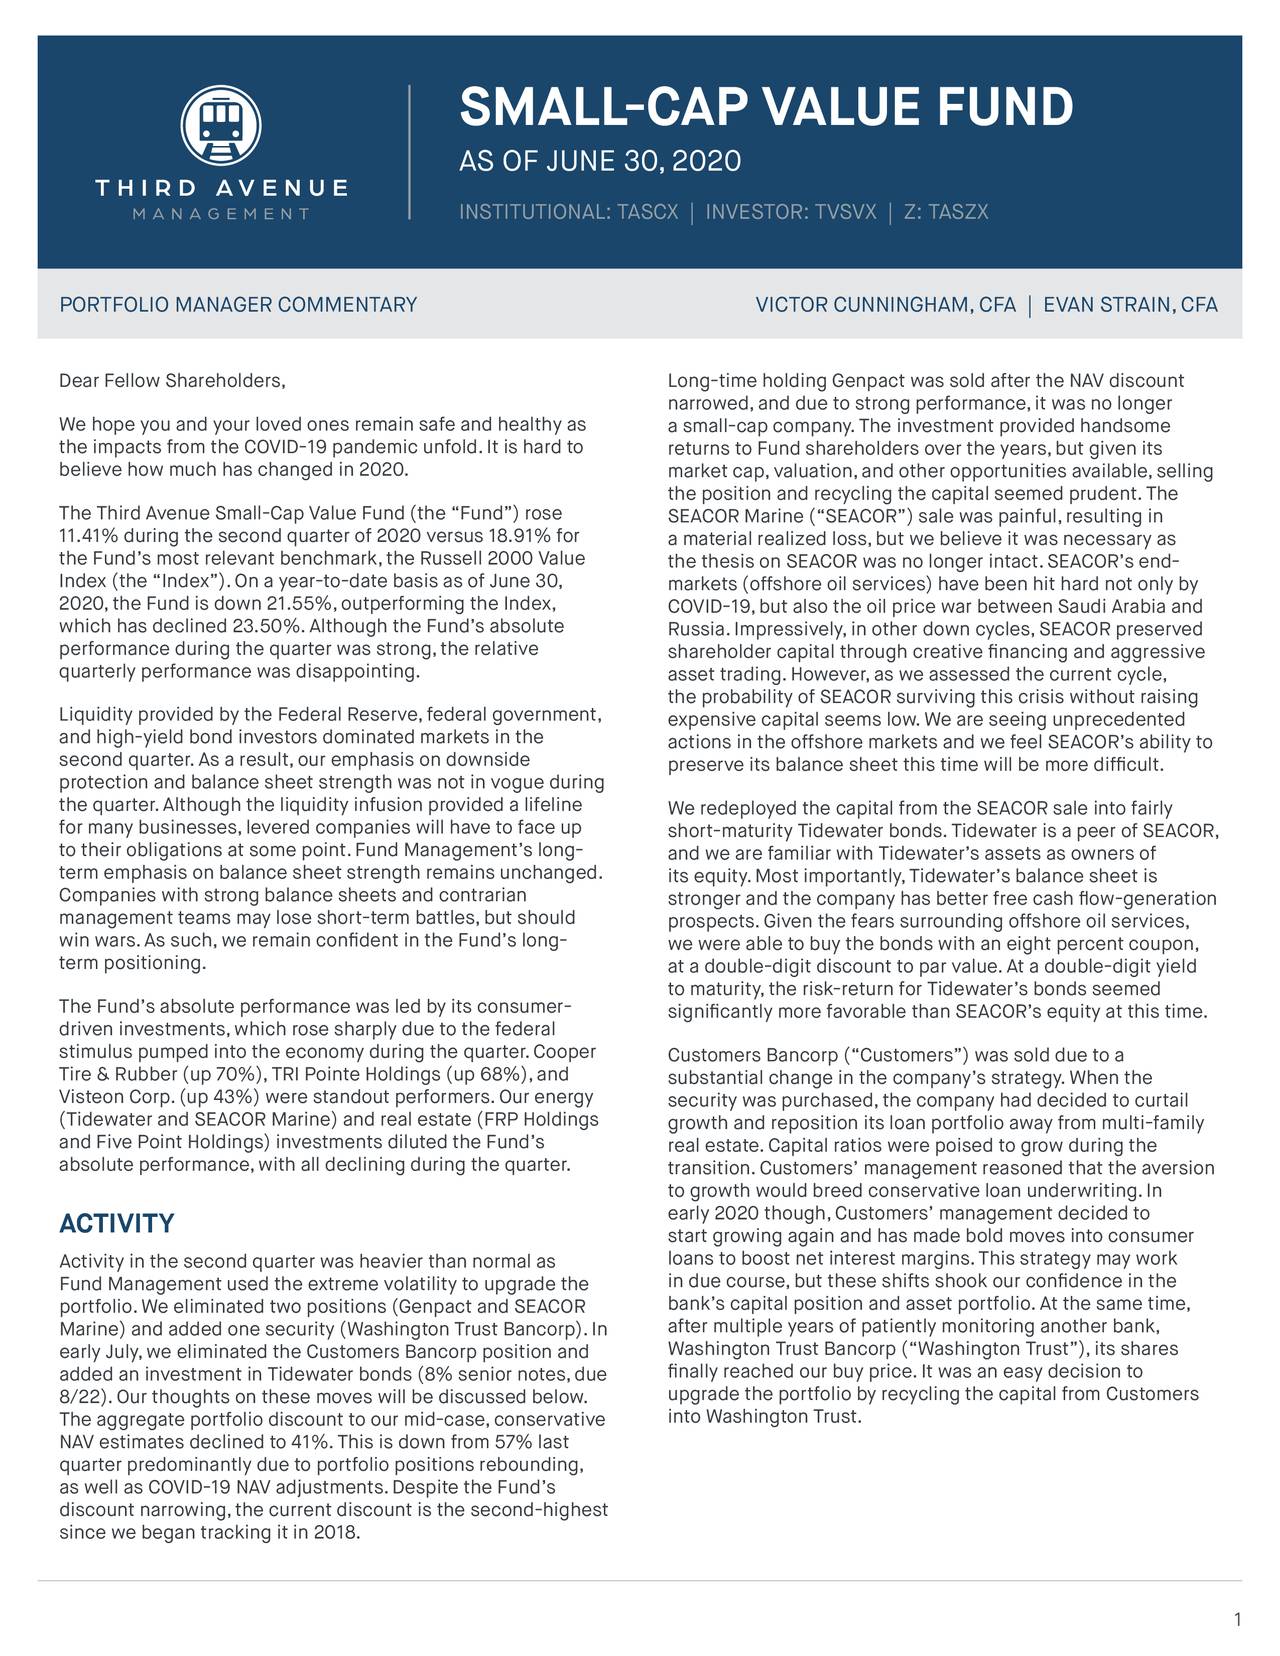
Third Avenue Small-Cap Value Fund Portfolio Manager Commentary Q2 2020

Playas para perros en España: consulta las costas a las que pueden ir

Struggling merchants hope Mission's Valencia Street will bustle again under traffic closure plan

El 'affaire' Metrovacesa o por qué Valencia es ahora tierra hostil para los promotores

Simulation: Can Giants beat Cards in replay of 1987 NLCS?

La Comunidad Valenciana suma ocho rebrotes y 16 nuevos contagios en 24 horas
Source: https://incomestatements.info
Category: Stock Reports
