See more : BioLineRx Ltd. (BLRX) Income Statement Analysis – Financial Results
Complete financial analysis of Fevertree Drinks PLC (FQVTF) income statement, including revenue, profit margins, EPS and key performance metrics. Get detailed insights into the financial performance of Fevertree Drinks PLC, a leading company in the Beverages – Non-Alcoholic industry within the Consumer Defensive sector.
- Kakao Games Corp. (293490.KQ) Income Statement Analysis – Financial Results
- Shanghai Hollywave Electronic System Co., Ltd. (688682.SS) Income Statement Analysis – Financial Results
- Evonik Industries AG (EVKIF) Income Statement Analysis – Financial Results
- River Eletec Corporation (6666.T) Income Statement Analysis – Financial Results
- YHN Acquisition I Limited Right (YHNAR) Income Statement Analysis – Financial Results
Fevertree Drinks PLC (FQVTF)
About Fevertree Drinks PLC
Fevertree Drinks Plc, together with its subsidiaries, develops and supplies premium mixer drinks in the United Kingdom, the United States, Europe, and internationally. The company's products include Indian tonic water, Mediterranean tonic water, elderflower tonic water, Clementine tonic water, ginger beer, ginger ale, and cola distillers. It sells its products under Fever-Tree brand name to pubs, bars, and restaurants. The company was formerly known as Fevertree Topco Limited and changed its name to Fevertree Drinks Plc in October 2014. Fevertree Drinks Plc was incorporated in 2013 and is headquartered in London, the United Kingdom.
| Metric | 2023 | 2022 | 2021 | 2020 | 2019 | 2018 | 2017 | 2016 | 2015 | 2014 | 2013 | 2012 | 2011 |
|---|---|---|---|---|---|---|---|---|---|---|---|---|---|
| Revenue | 364.40M | 344.30M | 311.10M | 252.10M | 260.50M | 237.45M | 170.17M | 102.24M | 59.25M | 34.69M | 23.30M | 16.25M | 11.84M |
| Cost of Revenue | 247.40M | 225.50M | 180.20M | 135.80M | 129.00M | 114.49M | 79.07M | 45.82M | 28.38M | 17.03M | 11.42M | 8.72M | 5.86M |
| Gross Profit | 117.00M | 118.80M | 130.90M | 116.30M | 131.50M | 122.96M | 91.10M | 56.42M | 30.87M | 17.66M | 11.88M | 7.53M | 5.99M |
| Gross Profit Ratio | 32.11% | 34.50% | 42.08% | 46.13% | 50.48% | 51.78% | 53.53% | 55.19% | 52.11% | 50.91% | 51.00% | 46.36% | 50.55% |
| Research & Development | 0.00 | 0.00 | 0.00 | 0.00 | 0.00 | 0.00 | 0.00 | 0.00 | 0.00 | 0.00 | 0.00 | 0.00 | 0.00 |
| General & Administrative | 96.20M | 88.20M | 75.30M | 65.00M | 59.30M | 47.60M | 34.69M | 22.05M | 13.61M | 9.57M | 8.90M | 3.92M | 2.82M |
| Selling & Marketing | 0.00 | 0.00 | 0.00 | 0.00 | 0.00 | 0.00 | 0.00 | 0.00 | 0.00 | 0.00 | 0.00 | 0.00 | 0.00 |
| SG&A | 96.20M | 88.20M | 75.30M | 65.00M | 59.30M | 47.60M | 34.69M | 22.05M | 13.61M | 9.57M | 8.90M | 3.92M | 2.82M |
| Other Expenses | 0.00 | 0.00 | 0.00 | 0.00 | 0.00 | 0.00 | 0.00 | 0.00 | 0.00 | 0.00 | 0.00 | 0.00 | 0.00 |
| Operating Expenses | 96.20M | 88.20M | 75.30M | 65.00M | 59.30M | 47.60M | 34.69M | 22.05M | 13.61M | 9.57M | 8.90M | 3.92M | 2.82M |
| Cost & Expenses | 343.60M | 313.70M | 255.50M | 200.80M | 188.30M | 162.09M | 113.77M | 67.86M | 41.98M | 26.60M | 20.32M | 12.63M | 8.67M |
| Interest Income | 2.00M | 800.00K | 300.00K | 500.00K | 500.00K | 327.20K | 94.89K | 79.82K | 27.97K | 9.22K | 16.14K | 10.03K | 4.01K |
| Interest Expense | 600.00K | 400.00K | 300.00K | 200.00K | 200.00K | 107.00K | 71.94K | 150.32K | 536.19K | 5.58M | 3.94M | 5.52K | 0.00 |
| Depreciation & Amortization | 8.00M | 5.80M | 4.70M | 3.80M | 2.90M | 1.46M | 1.13M | 969.32K | 843.93K | 801.30K | 604.39K | 10.26K | 6.28K |
| EBITDA | 30.80M | 37.20M | 60.60M | 55.60M | 75.60M | 77.10M | 57.62M | 35.41M | 18.14M | 7.67M | 3.40M | 3.64M | 3.18M |
| EBITDA Ratio | 8.45% | 10.80% | 19.48% | 22.05% | 29.02% | 32.49% | 33.86% | 34.65% | 30.62% | 25.65% | 14.60% | 22.38% | 26.84% |
| Operating Income | 20.80M | 30.60M | 55.60M | 51.30M | 72.20M | 75.36M | 56.40M | 34.37M | 17.27M | 8.09M | 2.98M | 3.62M | 3.17M |
| Operating Income Ratio | 5.71% | 8.89% | 17.87% | 20.35% | 27.72% | 31.74% | 33.15% | 33.62% | 29.14% | 23.31% | 12.80% | 22.25% | 26.75% |
| Total Other Income/Expenses | 1.40M | 400.00K | 0.00 | 300.00K | 300.00K | 177.40K | 22.88K | -70.50K | -508.22K | -5.57M | -4.08M | 4.51K | 4.01K |
| Income Before Tax | 22.20M | 31.00M | 55.60M | 51.60M | 72.50M | 75.58M | 56.43M | 34.30M | 16.76M | 2.52M | -1.10M | 3.62M | 3.17M |
| Income Before Tax Ratio | 6.09% | 9.00% | 17.87% | 20.47% | 27.83% | 31.83% | 33.16% | 33.55% | 28.29% | 7.27% | -4.71% | 22.28% | 26.79% |
| Income Tax Expense | 6.80M | 6.10M | 11.00M | 9.90M | 14.00M | 13.80M | 10.92M | 6.80M | 3.43M | 1.22M | 961.11K | 971.85K | 860.99K |
| Net Income | 15.40M | 24.90M | 44.60M | 41.70M | 58.50M | 61.80M | 45.51M | 27.50M | 13.33M | 1.30M | -2.06M | 2.65M | 2.31M |
| Net Income Ratio | 4.23% | 7.23% | 14.34% | 16.54% | 22.46% | 26.03% | 26.74% | 26.90% | 22.50% | 3.74% | -8.83% | 16.30% | 19.52% |
| EPS | 0.13 | 0.21 | 0.38 | 0.36 | 0.50 | 0.53 | 0.39 | 0.24 | 0.12 | 0.02 | -0.02 | 0.02 | 0.02 |
| EPS Diluted | 0.13 | 0.21 | 0.38 | 0.36 | 0.50 | 0.53 | 0.39 | 0.24 | 0.11 | 0.02 | -0.02 | 0.02 | 0.02 |
| Weighted Avg Shares Out | 116.63M | 116.56M | 116.54M | 116.28M | 116.13M | 115.73M | 115.26M | 115.24M | 115.24M | 83.93M | 115.24M | 115.24M | 115.24M |
| Weighted Avg Shares Out (Dil) | 116.83M | 116.78M | 116.84M | 116.61M | 116.57M | 116.13M | 116.24M | 116.03M | 116.09M | 84.07M | 115.24M | 115.24M | 115.24M |

Fevertree Drinks investors might need another stiff one on results day
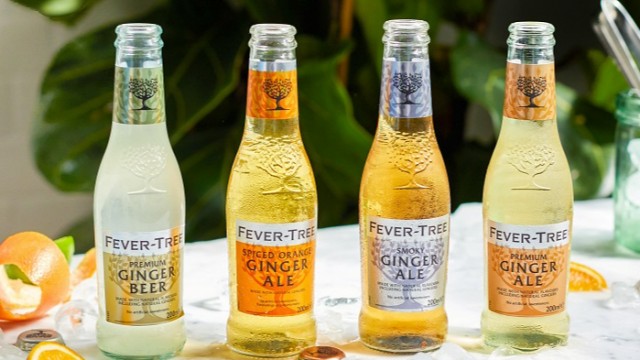
Fevertree Drinks PLC loses fizz as Berenberg downgrades its rating to 'hold' from 'buy'

Fevertree Drinks shares sparkle on 'strong' H1

Fevertree Drinks: Down 60% Since My Bearish Call, Almost Time To Go Long

Fevertree Drinks crashes lower on profit warning
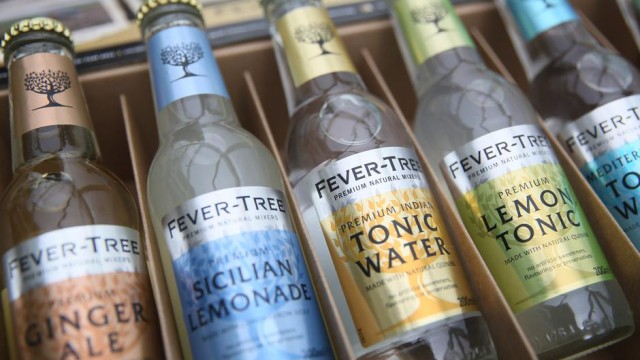
Tonic maker Fevertree cuts profit forecast as cost pressures increase

Fevertree Drinks says trading in line after 'solid start' to year

Fevertree Drinks: A Beneficiary Of The Premiumization Trend In Alcoholic Beverages

Fed, Fevertree and Wagamama in focus on Wednesday

Fevertree Drinks investors hope bar reopenings are Wednesday's perfect tonic
Source: https://incomestatements.info
Category: Stock Reports
