See more : Associated Banc-Corp (ASB-PE) Income Statement Analysis – Financial Results
Complete financial analysis of Freeline Therapeutics Holdings plc (FRLN) income statement, including revenue, profit margins, EPS and key performance metrics. Get detailed insights into the financial performance of Freeline Therapeutics Holdings plc, a leading company in the Biotechnology industry within the Healthcare sector.
- Light Science Technologies Holdings Plc (LST.L) Income Statement Analysis – Financial Results
- LeoVegas AB (publ) (LEO.ST) Income Statement Analysis – Financial Results
- Hoshizaki Corporation (6465.T) Income Statement Analysis – Financial Results
- Macpower CNC Machines Limited (MACPOWER.NS) Income Statement Analysis – Financial Results
- Techfirm Holdings Inc. (3625.T) Income Statement Analysis – Financial Results
Freeline Therapeutics Holdings plc (FRLN)
About Freeline Therapeutics Holdings plc
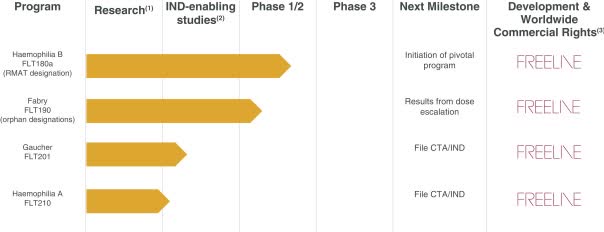
Freeline Therapeutics Holdings plc, a clinical-stage biotechnology company, develops transformative adeno-associated virus (AAV) vector-mediated gene therapies for patients suffering from inherited systemic debilitating diseases. Its advanced product candidate is verbrinacogene setparvovec (FLT180a), a gene therapy product candidate that is in Phase 1/2 clinical trials in adult males for the treatment of hemophilia B. The company's products also include FLT190, which is in Phase 1/2 clinical trial for the treatment of Fabry disease; and FLT201, a liver-directed gene therapy product candidate to treat type 1 Gaucher disease and is under Phase 1/2 clinical trial. In addition, it has research programs in various indications for systemic gene therapy. The company was founded in 2015 and is headquartered in Stevenage, the United Kingdom.
| Metric | 2022 | 2021 | 2020 | 2019 | 2018 |
|---|---|---|---|---|---|
| Revenue | 0.00 | 0.00 | 0.00 | 0.00 | 0.00 |
| Cost of Revenue | 1.74M | 2.39M | 1.93M | 1.55M | 0.00 |
| Gross Profit | -1.74M | -2.39M | -1.93M | -1.55M | 0.00 |
| Gross Profit Ratio | 0.00% | 0.00% | 0.00% | 0.00% | 0.00% |
| Research & Development | 66.20M | 95.43M | 76.15M | 47.04M | 34.19M |
| General & Administrative | 30.66M | 44.57M | 26.30M | 16.60M | 6.79M |
| Selling & Marketing | 0.00 | 0.00 | 0.00 | 0.00 | 0.00 |
| SG&A | 30.66M | 44.57M | 26.30M | 16.60M | 6.79M |
| Other Expenses | -1.57M | -2.09M | -15.27M | -10.60M | -390.00K |
| Operating Expenses | 95.29M | 137.91M | 87.18M | 53.05M | 32.72M |
| Cost & Expenses | 95.29M | 137.91M | 87.18M | 53.05M | 32.72M |
| Interest Income | 904.00K | 403.95K | 275.00K | 74.31K | 0.00 |
| Interest Expense | 0.00 | 0.00 | 0.00 | 0.00 | 151.00K |
| Depreciation & Amortization | 1.27M | 9.24M | 17.18M | 12.14M | 970.00K |
| EBITDA | -97.17M | -133.14M | -85.27M | -51.51M | -32.14M |
| EBITDA Ratio | 0.00% | 0.00% | 0.00% | 0.00% | 0.00% |
| Operating Income | -98.45M | -142.38M | -102.45M | -63.64M | -40.98M |
| Operating Income Ratio | 0.00% | 0.00% | 0.00% | 0.00% | 0.00% |
| Total Other Income/Expenses | 9.84M | 2.33M | 6.26M | 9.88M | -470.80K |
| Income Before Tax | -88.60M | -140.05M | -96.19M | -53.77M | -33.26M |
| Income Before Tax Ratio | 0.00% | 0.00% | 0.00% | 0.00% | 0.00% |
| Income Tax Expense | 368.00K | 342.00K | 129.00K | 141.00K | 27.00K |
| Net Income | -88.97M | -140.39M | -96.32M | -53.91M | -33.28M |
| Net Income Ratio | 0.00% | 0.00% | 0.00% | 0.00% | 0.00% |
| EPS | -22.52 | -58.98 | -102.09 | -127.39 | -78.65 |
| EPS Diluted | -22.52 | -58.98 | -102.09 | -127.39 | -78.65 |
| Weighted Avg Shares Out | 3.95M | 2.38M | 943.52K | 423.19K | 423.19K |
| Weighted Avg Shares Out (Dil) | 3.95M | 2.38M | 943.52K | 423.19K | 423.19K |

Freeline Reports Updated Data From Phase 1/2 B-AMAZE Trial in Hemophilia B

Citi Appointed as Depositary Bank for Freeline’s ADR Programme

IPO Update: Freeline Therapeutics Proposes Terms For U.S. IPO (Pending:FRLN)

Freeline Therapeutics Aims For $100 Million U.S. IPO

U.S. IPO Weekly Recap: nCino Pops 195% In 8-IPO Week
Source: https://incomestatements.info
Category: Stock Reports
