See more : SKAGEN – Kon-Tiki (SKIKON.CO) Income Statement Analysis – Financial Results
Complete financial analysis of Geely Automobile Holdings Limited (GELYF) income statement, including revenue, profit margins, EPS and key performance metrics. Get detailed insights into the financial performance of Geely Automobile Holdings Limited, a leading company in the Auto – Manufacturers industry within the Consumer Cyclical sector.
- Ashok Leyland Limited (ASHOKLEY.NS) Income Statement Analysis – Financial Results
- Allegro.eu SA (ALE.WA) Income Statement Analysis – Financial Results
- Ferrellgas Partners, L.P. (FGPR) Income Statement Analysis – Financial Results
- Athenex, Inc. (ATNX) Income Statement Analysis – Financial Results
- Micro-Mechanics (Holdings) Ltd. (MCRNF) Income Statement Analysis – Financial Results
Geely Automobile Holdings Limited (GELYF)
About Geely Automobile Holdings Limited
Geely Automobile Holdings Limited, an investment holding company, operates as an automobile manufacturer primarily in the People's Republic of China. The company engages in the research and development, production, marketing, and sale of vehicles, automobile parts, and related automobile components, as well as provision of related after-sales and technical services. It primarily offers sedans, wagons, sport utility cars, and electric vehicles under the Geely, Geometry, and ZEEKR brands. The company also provides vehicles design, technology consulting, general logistics, packing, and storage services; researches and develops technology; procures mechanical and electrical equipment; and manufactures and sells vehicle engines. It operates in Malaysia, Eastern Europe, the Middle East, Northern Europe, the Philippines, Central and South America, Africa, and other countries. The company is headquartered in Wan Chai, Hong Kong.
| Metric | 2023 | 2022 | 2021 | 2020 | 2019 | 2018 | 2017 | 2016 | 2015 | 2014 | 2013 | 2012 | 2011 | 2010 | 2009 | 2008 | 2007 | 2006 | 2005 | 2004 | 2003 | 2002 |
|---|---|---|---|---|---|---|---|---|---|---|---|---|---|---|---|---|---|---|---|---|---|---|
| Revenue | 179.20B | 147.96B | 101.61B | 92.11B | 97.40B | 106.60B | 92.76B | 53.72B | 30.14B | 21.74B | 28.71B | 24.63B | 20.96B | 20.10B | 14.07B | 4.29B | 128.54M | 127.35M | 105.56M | 43.81M | 42.51M | 76.22M |
| Cost of Revenue | 151.79B | 127.07B | 84.20B | 77.38B | 80.48B | 85.08B | 74.78B | 43.88B | 24.67B | 17.78B | 22.94B | 20.07B | 17.14B | 16.40B | 11.53B | 3.64B | 113.59M | 110.33M | 94.36M | 40.98M | 34.01M | 55.06M |
| Gross Profit | 27.42B | 20.90B | 17.41B | 14.74B | 16.92B | 21.51B | 17.98B | 9.84B | 5.47B | 3.96B | 5.77B | 4.56B | 3.82B | 3.70B | 2.54B | 651.29M | 14.95M | 17.02M | 11.20M | 2.83M | 8.50M | 21.16M |
| Gross Profit Ratio | 15.30% | 14.12% | 17.14% | 16.00% | 17.37% | 20.18% | 19.38% | 18.32% | 18.15% | 18.23% | 20.08% | 18.51% | 18.22% | 18.41% | 18.06% | 15.18% | 11.63% | 13.36% | 10.61% | 6.46% | 19.99% | 27.77% |
| Research & Development | 0.00 | 6.76B | 0.00 | 3.74B | 3.07B | 2.19B | 1.78B | 1.22B | 924.85M | 628.41M | 900.88M | 518.24M | 0.00 | 0.00 | 0.00 | 0.00 | 0.00 | 0.00 | 0.00 | 0.00 | 0.00 | 0.00 |
| General & Administrative | 12.02B | 10.29B | 7.91B | 5.75B | 5.12B | 3.78B | 2.92B | 2.56B | 2.18B | 1.77B | 1.68B | 1.32B | 962.98M | 922.88M | 524.13M | 282.54M | 47.28M | 25.63M | 19.52M | 16.49M | 21.79M | 38.25M |
| Selling & Marketing | 11.83B | 8.23B | 6.32B | 5.05B | 4.33B | 4.52B | 4.06B | 2.50B | 1.57B | 1.25B | 1.71B | 1.48B | 1.36B | 1.19B | 764.56M | 219.81M | 0.00 | 0.00 | 0.00 | 0.00 | 0.00 | 0.00 |
| SG&A | 23.85B | 18.52B | 14.23B | 10.80B | 9.45B | 8.30B | 6.98B | 5.06B | 3.74B | 3.02B | 3.39B | 2.80B | 2.32B | 2.11B | 1.29B | 502.34M | 47.28M | 25.63M | 19.52M | 16.49M | 21.79M | 38.25M |
| Other Expenses | 3.56B | 1.13B | 118.74M | -1.00B | -886.80M | 213.94M | 171.43M | 76.17M | 92.12M | 82.09M | 129.65M | 103.65M | 0.00 | 0.00 | -10.74M | 346.09M | 331.89M | 224.93M | 128.42M | 110.11M | 72.71M | -92.52M |
| Operating Expenses | 27.42B | 19.65B | 14.35B | 9.80B | 8.57B | 7.29B | 6.07B | 4.29B | 2.91B | 2.18B | 2.63B | 1.95B | 1.42B | 1.55B | 857.16M | 144.83M | 47.28M | 25.63M | 19.52M | 16.39M | 22.60M | 49.81M |
| Cost & Expenses | 174.80B | 146.72B | 98.55B | 87.17B | 89.05B | 92.37B | 80.85B | 48.17B | 27.57B | 19.96B | 25.57B | 22.02B | 18.56B | 17.95B | 12.39B | 3.78B | 160.86M | 135.96M | 113.88M | 57.37M | 56.61M | 104.87M |
| Interest Income | 961.36M | 931.16M | 544.98M | 375.30M | 235.60M | 192.92M | 127.06M | 85.43M | 96.91M | 57.63M | 59.26M | 42.16M | 44.08M | 0.00 | 0.00 | 0.00 | 0.00 | 0.00 | 0.00 | 0.00 | 0.00 | 0.00 |
| Interest Expense | 417.01M | 550.69M | 264.83M | 166.98M | 127.58M | 113.93M | 110.28M | 115.53M | 103.35M | 81.33M | 99.24M | 236.76M | 211.36M | 0.00 | 0.00 | 60.95M | 33.70M | 0.00 | 0.00 | 0.00 | 0.00 | 0.00 |
| Depreciation & Amortization | 8.20B | 8.32B | 6.89B | 5.49B | 3.73B | 2.41B | 1.94B | 1.65B | 1.14B | 873.55M | 1.08B | 860.10M | 641.91M | 524.72M | 364.60M | 141.05M | 2.14M | 0.00 | 844.20K | 757.50K | 1.31M | 2.00M |
| EBITDA | 13.57B | 13.45B | 11.82B | 12.10B | 13.50B | 17.49B | 14.82B | 7.97B | 4.12B | 2.90B | 4.48B | 3.63B | 3.04B | 2.68B | 2.05B | 647.51M | 343.26M | -7.20M | -7.48M | -12.81M | -12.10M | -26.65M |
| EBITDA Ratio | 7.57% | 7.86% | 11.68% | 12.71% | 13.67% | 16.40% | 15.39% | 14.14% | 13.43% | 12.99% | 15.31% | 14.66% | 14.52% | 13.32% | 14.56% | 26.11% | -23.49% | -6.76% | -7.08% | -29.23% | -30.07% | -34.97% |
| Operating Income | 3.92B | 3.31B | 4.98B | 6.22B | 9.58B | 15.03B | 13.18B | 5.87B | 2.73B | 1.93B | 3.22B | 2.73B | 2.40B | 2.15B | 1.58B | 506.45M | -32.33M | -8.61M | -8.32M | -13.56M | -13.41M | -26.03M |
| Operating Income Ratio | 2.19% | 2.24% | 4.90% | 6.75% | 9.84% | 14.10% | 14.21% | 10.92% | 9.06% | 8.90% | 11.22% | 11.07% | 11.46% | 10.71% | 11.20% | 11.81% | -25.15% | -6.76% | -7.88% | -30.96% | -31.54% | -34.16% |
| Total Other Income/Expenses | 1.03B | 1.37B | -314.18M | 223.98M | 56.12M | 737.55M | -404.33M | 1.47B | 1.21B | 8.79M | 83.24M | 851.37M | -218.56M | -252.09M | -25.89M | 411.47M | 339.70M | 224.93M | 128.42M | 110.11M | 72.71M | -92.52M |
| Income Before Tax | 4.95B | 4.68B | 4.67B | 6.44B | 9.64B | 14.96B | 12.77B | 6.20B | 2.87B | 1.94B | 3.30B | 2.53B | 2.18B | 1.90B | 1.55B | 917.92M | 299.56M | 216.32M | 120.10M | 96.55M | 59.30M | -118.55M |
| Income Before Tax Ratio | 2.76% | 3.16% | 4.59% | 6.99% | 9.89% | 14.03% | 13.77% | 11.55% | 9.54% | 8.94% | 11.51% | 10.27% | 10.41% | 9.45% | 11.02% | 21.40% | 233.06% | 169.86% | 113.77% | 220.36% | 139.50% | -155.54% |
| Income Tax Expense | 14.92M | 32.28M | 312.17M | 866.35M | 1.37B | 2.28B | 2.04B | 1.03B | 586.14M | 494.18M | 623.93M | 479.29M | 467.36M | 350.61M | 231.43M | 51.87M | 1.57M | 1.59M | 0.42 | 7.13M | 252.70K | 55.19K |
| Net Income | 5.31B | 5.26B | 4.85B | 5.53B | 8.19B | 12.55B | 10.63B | 5.11B | 2.26B | 1.43B | 2.66B | 2.04B | 1.54B | 1.37B | 1.18B | 879.05M | 297.99M | 214.73M | 120.10M | 89.91M | 61.29M | -112.47M |
| Net Income Ratio | 2.96% | 3.56% | 4.77% | 6.01% | 8.41% | 11.78% | 11.46% | 9.52% | 7.50% | 6.58% | 9.28% | 8.28% | 7.36% | 6.81% | 8.41% | 20.50% | 231.84% | 168.61% | 113.77% | 205.22% | 144.18% | -147.56% |
| EPS | 0.51 | 0.51 | 0.48 | 0.56 | 0.90 | 1.40 | 1.19 | 0.58 | 0.26 | 0.16 | 0.32 | 0.27 | 0.21 | 0.19 | 0.17 | 0.15 | 0.06 | 0.05 | 0.03 | 0.02 | 0.02 | -0.05 |
| EPS Diluted | 0.51 | 0.50 | 0.48 | 0.56 | 0.89 | 1.37 | 1.16 | 0.57 | 0.26 | 0.16 | 0.30 | 0.26 | 0.19 | 0.17 | 0.17 | 0.14 | 0.06 | 0.05 | 0.03 | 0.02 | 0.02 | -0.05 |
| Weighted Avg Shares Out | 10.06B | 10.03B | 9.82B | 9.55B | 9.08B | 8.98B | 8.93B | 8.82B | 8.80B | 8.80B | 8.39B | 7.54B | 7.45B | 7.31B | 6.93B | 5.85B | 4.93B | 4.13B | 4.12B | 4.13B | 3.59B | 2.46B |
| Weighted Avg Shares Out (Dil) | 10.13B | 10.15B | 9.89B | 9.56B | 9.18B | 9.17B | 9.16B | 8.92B | 8.81B | 8.80B | 8.80B | 8.10B | 8.53B | 7.36B | 7.18B | 6.23B | 5.01B | 4.22B | 4.12B | 4.13B | 3.59B | 2.46B |

Aramco to acquire 10% equity interest in HORSE Powertrain Limited, the new global powertrain solutions company established by Renault Group and Geely

Aramco to buy 10% stake in Renault, Geely thermal engines JV
China's Geely expresses disappointment in EU tariff decision, vows 'necessary measures' to safeguard rights
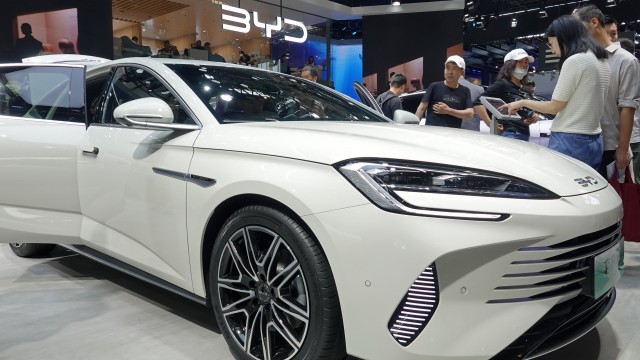
Chinese EV stocks surge after EU slaps up to 38% additional import tariffs
Renault, Geely create joint venture for hybrid, combustion engines
China's Geely to launch hybrids with more fuel-efficient engines

XPeng (XPEV) Aims to Begin Deliveries of Flying Car in 2026
Geely, Foretellix partner to jump-start self driving car development

Geely-backed luxury EV brand Zeekr says it's already beating Tesla in parts of China

Geely: Bullish On Q4 Earnings Beat And Re-Rating Catalysts
Source: https://incomestatements.info
Category: Stock Reports
