See more : Westinghouse Air Brake Technologies Corporation (WAB) Income Statement Analysis – Financial Results
Complete financial analysis of Geely Automobile Holdings Limited (GELYY) income statement, including revenue, profit margins, EPS and key performance metrics. Get detailed insights into the financial performance of Geely Automobile Holdings Limited, a leading company in the Auto – Manufacturers industry within the Consumer Cyclical sector.
- mCloud Technologies Corp. (MCLDF) Income Statement Analysis – Financial Results
- Lumos Pharma, Inc. (LUMO) Income Statement Analysis – Financial Results
- USERJOY Technology Co.,Ltd. (3546.TWO) Income Statement Analysis – Financial Results
- IndiaMART InterMESH Limited (INDIAMART.NS) Income Statement Analysis – Financial Results
- GoldOz Limited (MTTGF) Income Statement Analysis – Financial Results
Geely Automobile Holdings Limited (GELYY)
About Geely Automobile Holdings Limited
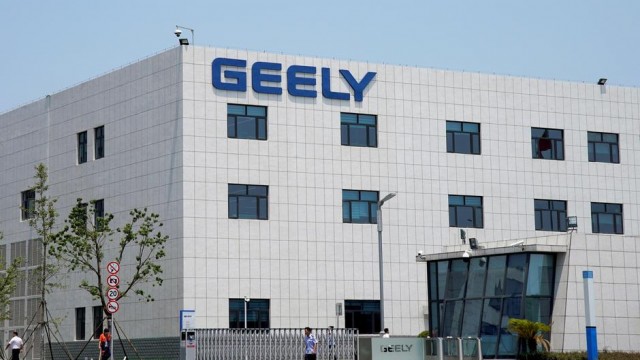
Geely Automobile Holdings Limited, an investment holding company, operates as an automobile manufacturer primarily in the People's Republic of China. The company engages in the research and development, production, marketing, and sale of vehicles, automobile parts, and related automobile components, as well as provision of related after-sales and technical services. It primarily offers sedans, wagons, sport utility cars, and electric vehicles under the Geely, Geometry, and ZEEKR brands. The company also provides vehicles design, technology consulting, general logistics, packing, and storage services; researches and develops technology; procures mechanical and electrical equipment; and manufactures and sells vehicle engines. It operates in Malaysia, Eastern Europe, the Middle East, Northern Europe, the Philippines, Central and South America, Africa, and other countries. The company is headquartered in Wan Chai, Hong Kong.
| Metric | 2023 | 2022 | 2021 | 2020 | 2019 | 2018 | 2017 | 2016 | 2015 | 2014 | 2013 | 2012 | 2011 | 2010 | 2009 | 2008 | 2007 | 2006 | 2005 | 2004 | 2003 | 2002 |
|---|---|---|---|---|---|---|---|---|---|---|---|---|---|---|---|---|---|---|---|---|---|---|
| Revenue | 179.20B | 147.96B | 101.61B | 92.11B | 97.40B | 106.60B | 92.76B | 53.72B | 30.14B | 21.74B | 28.71B | 24.63B | 20.96B | 20.10B | 14.07B | 4.29B | 128.54M | 127.35M | 105.56M | 43.81M | 42.51M | 76.22M |
| Cost of Revenue | 151.79B | 127.07B | 84.20B | 77.38B | 80.48B | 85.08B | 74.78B | 43.88B | 24.67B | 17.78B | 22.94B | 20.07B | 17.14B | 16.40B | 11.53B | 3.64B | 113.59M | 110.33M | 94.36M | 40.98M | 34.01M | 55.06M |
| Gross Profit | 27.42B | 20.90B | 17.41B | 14.74B | 16.92B | 21.51B | 17.98B | 9.84B | 5.47B | 3.96B | 5.77B | 4.56B | 3.82B | 3.70B | 2.54B | 651.29M | 14.95M | 17.02M | 11.20M | 2.83M | 8.50M | 21.16M |
| Gross Profit Ratio | 15.30% | 14.12% | 17.14% | 16.00% | 17.37% | 20.18% | 19.38% | 18.32% | 18.15% | 18.23% | 20.08% | 18.51% | 18.22% | 18.41% | 18.06% | 15.18% | 11.63% | 13.36% | 10.61% | 6.46% | 19.99% | 27.77% |
| Research & Development | 0.00 | 1.97B | 1.29B | 588.10M | 850.47M | 548.65M | 331.24M | 211.53M | 258.77M | 502.61M | 703.39M | 416.78M | 0.00 | 0.00 | 0.00 | 0.00 | 0.00 | 0.00 | 0.00 | 0.00 | 0.00 | 0.00 |
| General & Administrative | 12.02B | 10.29B | 7.91B | 5.75B | 5.12B | 3.78B | 2.92B | 2.56B | 2.18B | 1.77B | 1.68B | 1.32B | 962.98M | 922.88M | 524.13M | 282.54M | 47.28M | 25.63M | 19.52M | 16.49M | 21.79M | 38.25M |
| Selling & Marketing | 11.83B | 8.23B | 6.32B | 5.05B | 4.33B | 4.52B | 4.06B | 2.50B | 1.57B | 1.25B | 1.71B | 1.48B | 1.36B | 1.19B | 764.56M | 219.81M | 3.06M | 0.00 | 0.00 | 0.00 | 0.00 | 0.00 |
| SG&A | 23.85B | 18.52B | 14.23B | 10.80B | 9.45B | 8.30B | 6.98B | 5.06B | 3.74B | 3.02B | 3.39B | 2.80B | 2.32B | 2.11B | 1.29B | 502.34M | 47.28M | 25.63M | 19.52M | 16.49M | 21.79M | 38.25M |
| Other Expenses | 3.56B | 1.13B | 118.74M | -1.00B | -886.80M | 213.94M | 171.43M | 76.17M | 92.12M | 82.09M | 129.65M | 103.65M | -903.97M | -565.67M | -10.74M | 346.09M | 331.89M | 224.93M | 128.42M | 110.11M | 72.71M | -92.52M |
| Operating Expenses | 27.42B | 19.65B | 14.35B | 9.80B | 8.57B | 7.29B | 6.07B | 4.29B | 2.91B | 2.18B | 2.63B | 1.95B | 1.42B | 1.55B | 857.16M | 144.83M | 47.28M | 25.63M | 19.52M | 16.39M | 22.60M | 49.81M |
| Cost & Expenses | 179.20B | 146.72B | 98.55B | 87.17B | 89.05B | 92.37B | 80.85B | 48.17B | 27.57B | 19.96B | 25.57B | 22.02B | 18.56B | 17.95B | 12.39B | 3.78B | 160.86M | 135.96M | 113.88M | 57.37M | 56.61M | 104.87M |
| Interest Income | 961.36M | 931.16M | 544.98M | 375.30M | 235.60M | 192.92M | 127.06M | 85.43M | 96.91M | 57.63M | 59.26M | 42.16M | 44.08M | 0.00 | 0.00 | 0.00 | 0.00 | 0.00 | 0.00 | 0.00 | 0.00 | 0.00 |
| Interest Expense | 417.01M | 550.69M | 264.83M | 166.98M | 127.58M | 113.93M | 110.28M | 115.53M | 103.35M | 81.33M | 99.24M | 236.76M | 211.36M | 0.00 | 0.00 | 60.95M | 33.70M | 0.00 | 0.00 | 0.00 | 0.00 | 0.00 |
| Depreciation & Amortization | 8.20B | 8.32B | 6.89B | 5.49B | 3.73B | 2.36B | 1.89B | 1.61B | 1.14B | 873.55M | 1.08B | 860.10M | 641.91M | 524.72M | 364.60M | 141.05M | 2.14M | 1.41M | 844.20K | 757.50K | 1.31M | 2.00M |
| EBITDA | 13.57B | 13.45B | 11.82B | 12.10B | 13.50B | 17.49B | 14.82B | 7.97B | 4.12B | 2.90B | 4.48B | 3.63B | 3.04B | 2.68B | 2.05B | 647.51M | 343.26M | -7.20M | -7.48M | -12.81M | -12.10M | -26.65M |
| EBITDA Ratio | 7.57% | 7.86% | 11.68% | 12.71% | 13.67% | 16.40% | 15.39% | 14.14% | 13.43% | 12.99% | 15.31% | 14.66% | 14.52% | 13.32% | 14.56% | 26.11% | -23.49% | -6.76% | -7.08% | -29.23% | -30.07% | -34.97% |
| Operating Income | 3.06B | 3.31B | 4.98B | 6.22B | 9.58B | 14.22B | 11.91B | 5.87B | 2.73B | 1.93B | 3.22B | 2.73B | 2.40B | 2.15B | 1.58B | 506.45M | -32.33M | -8.61M | -8.32M | -13.56M | -13.41M | -26.03M |
| Operating Income Ratio | 1.71% | 2.24% | 4.90% | 6.75% | 9.84% | 13.34% | 12.84% | 10.92% | 9.06% | 8.90% | 11.22% | 11.07% | 11.46% | 10.71% | 11.20% | 11.81% | -25.15% | -6.76% | -7.88% | -30.96% | -31.54% | -34.16% |
| Total Other Income/Expenses | 1.89B | 3.23B | 1.93B | 1.66B | 56.12M | 737.55M | 866.78M | 1.47B | 1.21B | 8.79M | 83.24M | -196.32M | -218.56M | -252.09M | -25.89M | 411.47M | 339.70M | 224.93M | 128.42M | 110.11M | 72.71M | -92.52M |
| Income Before Tax | 4.95B | 4.68B | 4.67B | 6.44B | 9.64B | 14.96B | 12.77B | 6.20B | 2.87B | 1.94B | 3.30B | 2.53B | 2.18B | 1.90B | 1.55B | 917.92M | 299.56M | 216.32M | 120.10M | 96.55M | 59.30M | -118.55M |
| Income Before Tax Ratio | 2.76% | 3.16% | 4.59% | 6.99% | 9.89% | 14.03% | 13.77% | 11.55% | 9.54% | 8.94% | 11.51% | 10.27% | 10.41% | 9.45% | 11.02% | 21.40% | 233.06% | 169.86% | 113.77% | 220.36% | 139.50% | -155.54% |
| Income Tax Expense | 14.92M | 32.28M | 312.17M | 866.35M | 1.37B | 2.28B | 2.04B | 1.03B | 586.14M | 494.18M | 623.93M | 479.29M | 467.36M | 350.61M | 231.43M | 51.87M | 1.57M | 1.59M | 4.74M | 7.13M | 252.70K | 55.19K |
| Net Income | 5.31B | 5.26B | 4.85B | 5.53B | 8.19B | 12.55B | 10.63B | 5.11B | 2.26B | 1.43B | 2.66B | 2.04B | 1.54B | 1.37B | 1.18B | 879.05M | 302.53M | 209.32M | 115.36M | 86.62M | 61.29M | -112.47M |
| Net Income Ratio | 2.96% | 3.56% | 4.77% | 6.01% | 8.41% | 11.78% | 11.46% | 9.52% | 7.50% | 6.58% | 9.28% | 8.28% | 7.36% | 6.81% | 8.41% | 20.50% | 235.36% | 164.36% | 109.28% | 197.71% | 144.18% | -147.56% |
| EPS | 0.51 | 0.51 | 0.48 | 0.56 | 0.90 | 27.97 | 23.80 | 11.60 | 5.14 | 3.25 | 6.35 | 5.41 | 4.14 | 3.72 | 3.42 | 3.00 | 1.23 | 1.01 | 0.56 | 0.42 | 0.34 | -0.91 |
| EPS Diluted | 0.51 | 0.50 | 0.48 | 0.56 | 0.89 | 27.37 | 23.20 | 11.40 | 5.13 | 3.25 | 6.08 | 5.27 | 3.84 | 3.43 | 3.33 | 2.86 | 1.21 | 0.99 | 0.56 | 0.42 | 0.34 | -0.91 |
| Weighted Avg Shares Out | 10.06B | 10.03B | 9.82B | 9.55B | 9.08B | 448.82M | 446.61M | 441.03M | 440.08M | 440.07M | 419.58M | 377.06M | 372.52M | 365.54M | 346.33M | 292.27M | 246.52M | 206.69M | 206.00M | 206.36M | 179.64M | 123.23M |
| Weighted Avg Shares Out (Dil) | 10.13B | 10.15B | 9.89B | 9.56B | 9.18B | 458.70M | 457.78M | 445.85M | 440.48M | 440.07M | 440.07M | 404.96M | 426.41M | 368.14M | 358.75M | 311.27M | 250.44M | 210.86M | 206.00M | 206.36M | 179.64M | 123.23M |

Aston Martin up 14% as Geely makes big investment

Geely doubles stake in Aston Martin with China the prize

Geely's London black cab unit unveils new large EV platform

EV Company News For The Month Of March 2023

China's Meizu unveils first smartphones since deal with Geely founder

Geely shares jump after automaker beats revenue expectations for 2022

5 Tesla Killers Worth a Spot in Your 2023 Stock Portfolio

EV Company News For The Month Of February 2023

Renault, Geely ink pact with Aramco for engine venture

Dear PSNY Stock Fans, Mark Your Calendars for March 2
Source: https://incomestatements.info
Category: Stock Reports
