Complete financial analysis of Geely Automobile Holdings Limited (GELYY) income statement, including revenue, profit margins, EPS and key performance metrics. Get detailed insights into the financial performance of Geely Automobile Holdings Limited, a leading company in the Auto – Manufacturers industry within the Consumer Cyclical sector.
- Austin Engineering Limited (ANG.AX) Income Statement Analysis – Financial Results
- Magyar Telekom Távközlési Nyilvánosan Müködö Részvénytársaság (MYTAY) Income Statement Analysis – Financial Results
- Arizona Metals Corp. (AZMCF) Income Statement Analysis – Financial Results
- Deceuninck NV (DECB.BR) Income Statement Analysis – Financial Results
- Orient Paper & Industries Limited (ORIENTPPR.NS) Income Statement Analysis – Financial Results
Geely Automobile Holdings Limited (GELYY)
About Geely Automobile Holdings Limited
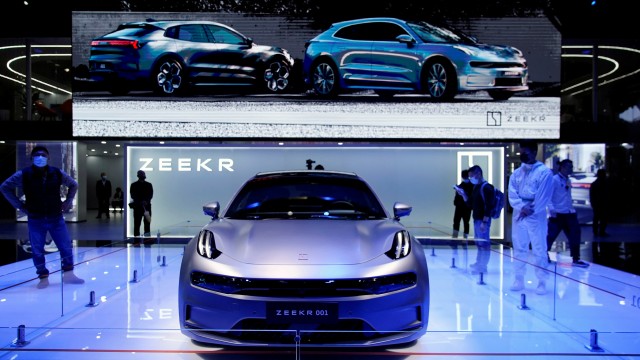
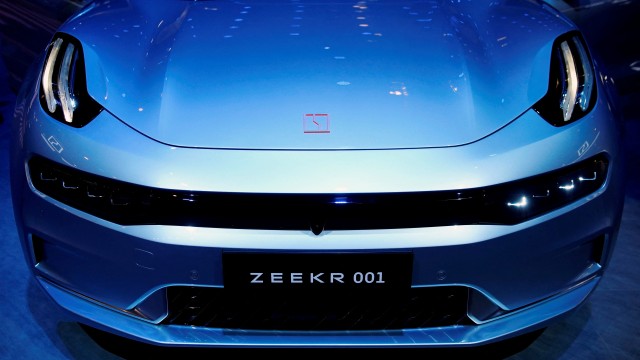
Geely Automobile Holdings Limited, an investment holding company, operates as an automobile manufacturer primarily in the People's Republic of China. The company engages in the research and development, production, marketing, and sale of vehicles, automobile parts, and related automobile components, as well as provision of related after-sales and technical services. It primarily offers sedans, wagons, sport utility cars, and electric vehicles under the Geely, Geometry, and ZEEKR brands. The company also provides vehicles design, technology consulting, general logistics, packing, and storage services; researches and develops technology; procures mechanical and electrical equipment; and manufactures and sells vehicle engines. It operates in Malaysia, Eastern Europe, the Middle East, Northern Europe, the Philippines, Central and South America, Africa, and other countries. The company is headquartered in Wan Chai, Hong Kong.
| Metric | 2023 | 2022 | 2021 | 2020 | 2019 | 2018 | 2017 | 2016 | 2015 | 2014 | 2013 | 2012 | 2011 | 2010 | 2009 | 2008 | 2007 | 2006 | 2005 | 2004 | 2003 | 2002 |
|---|---|---|---|---|---|---|---|---|---|---|---|---|---|---|---|---|---|---|---|---|---|---|
| Revenue | 179.20B | 147.96B | 101.61B | 92.11B | 97.40B | 106.60B | 92.76B | 53.72B | 30.14B | 21.74B | 28.71B | 24.63B | 20.96B | 20.10B | 14.07B | 4.29B | 128.54M | 127.35M | 105.56M | 43.81M | 42.51M | 76.22M |
| Cost of Revenue | 151.79B | 127.07B | 84.20B | 77.38B | 80.48B | 85.08B | 74.78B | 43.88B | 24.67B | 17.78B | 22.94B | 20.07B | 17.14B | 16.40B | 11.53B | 3.64B | 113.59M | 110.33M | 94.36M | 40.98M | 34.01M | 55.06M |
| Gross Profit | 27.42B | 20.90B | 17.41B | 14.74B | 16.92B | 21.51B | 17.98B | 9.84B | 5.47B | 3.96B | 5.77B | 4.56B | 3.82B | 3.70B | 2.54B | 651.29M | 14.95M | 17.02M | 11.20M | 2.83M | 8.50M | 21.16M |
| Gross Profit Ratio | 15.30% | 14.12% | 17.14% | 16.00% | 17.37% | 20.18% | 19.38% | 18.32% | 18.15% | 18.23% | 20.08% | 18.51% | 18.22% | 18.41% | 18.06% | 15.18% | 11.63% | 13.36% | 10.61% | 6.46% | 19.99% | 27.77% |
| Research & Development | 0.00 | 1.97B | 1.29B | 588.10M | 850.47M | 548.65M | 331.24M | 211.53M | 258.77M | 502.61M | 703.39M | 416.78M | 0.00 | 0.00 | 0.00 | 0.00 | 0.00 | 0.00 | 0.00 | 0.00 | 0.00 | 0.00 |
| General & Administrative | 12.02B | 10.29B | 7.91B | 5.75B | 5.12B | 3.78B | 2.92B | 2.56B | 2.18B | 1.77B | 1.68B | 1.32B | 962.98M | 922.88M | 524.13M | 282.54M | 47.28M | 25.63M | 19.52M | 16.49M | 21.79M | 38.25M |
| Selling & Marketing | 11.83B | 8.23B | 6.32B | 5.05B | 4.33B | 4.52B | 4.06B | 2.50B | 1.57B | 1.25B | 1.71B | 1.48B | 1.36B | 1.19B | 764.56M | 219.81M | 3.06M | 0.00 | 0.00 | 0.00 | 0.00 | 0.00 |
| SG&A | 23.85B | 18.52B | 14.23B | 10.80B | 9.45B | 8.30B | 6.98B | 5.06B | 3.74B | 3.02B | 3.39B | 2.80B | 2.32B | 2.11B | 1.29B | 502.34M | 47.28M | 25.63M | 19.52M | 16.49M | 21.79M | 38.25M |
| Other Expenses | 3.56B | 1.13B | 118.74M | -1.00B | -886.80M | 213.94M | 171.43M | 76.17M | 92.12M | 82.09M | 129.65M | 103.65M | -903.97M | -565.67M | -10.74M | 346.09M | 331.89M | 224.93M | 128.42M | 110.11M | 72.71M | -92.52M |
| Operating Expenses | 27.42B | 19.65B | 14.35B | 9.80B | 8.57B | 7.29B | 6.07B | 4.29B | 2.91B | 2.18B | 2.63B | 1.95B | 1.42B | 1.55B | 857.16M | 144.83M | 47.28M | 25.63M | 19.52M | 16.39M | 22.60M | 49.81M |
| Cost & Expenses | 179.20B | 146.72B | 98.55B | 87.17B | 89.05B | 92.37B | 80.85B | 48.17B | 27.57B | 19.96B | 25.57B | 22.02B | 18.56B | 17.95B | 12.39B | 3.78B | 160.86M | 135.96M | 113.88M | 57.37M | 56.61M | 104.87M |
| Interest Income | 961.36M | 931.16M | 544.98M | 375.30M | 235.60M | 192.92M | 127.06M | 85.43M | 96.91M | 57.63M | 59.26M | 42.16M | 44.08M | 0.00 | 0.00 | 0.00 | 0.00 | 0.00 | 0.00 | 0.00 | 0.00 | 0.00 |
| Interest Expense | 417.01M | 550.69M | 264.83M | 166.98M | 127.58M | 113.93M | 110.28M | 115.53M | 103.35M | 81.33M | 99.24M | 236.76M | 211.36M | 0.00 | 0.00 | 60.95M | 33.70M | 0.00 | 0.00 | 0.00 | 0.00 | 0.00 |
| Depreciation & Amortization | 8.20B | 8.32B | 6.89B | 5.49B | 3.73B | 2.36B | 1.89B | 1.61B | 1.14B | 873.55M | 1.08B | 860.10M | 641.91M | 524.72M | 364.60M | 141.05M | 2.14M | 1.41M | 844.20K | 757.50K | 1.31M | 2.00M |
| EBITDA | 13.57B | 13.45B | 11.82B | 12.10B | 13.50B | 17.49B | 14.82B | 7.97B | 4.12B | 2.90B | 4.48B | 3.63B | 3.04B | 2.68B | 2.05B | 647.51M | 343.26M | -7.20M | -7.48M | -12.81M | -12.10M | -26.65M |
| EBITDA Ratio | 7.57% | 7.86% | 11.68% | 12.71% | 13.67% | 16.40% | 15.39% | 14.14% | 13.43% | 12.99% | 15.31% | 14.66% | 14.52% | 13.32% | 14.56% | 26.11% | -23.49% | -6.76% | -7.08% | -29.23% | -30.07% | -34.97% |
| Operating Income | 3.06B | 3.31B | 4.98B | 6.22B | 9.58B | 14.22B | 11.91B | 5.87B | 2.73B | 1.93B | 3.22B | 2.73B | 2.40B | 2.15B | 1.58B | 506.45M | -32.33M | -8.61M | -8.32M | -13.56M | -13.41M | -26.03M |
| Operating Income Ratio | 1.71% | 2.24% | 4.90% | 6.75% | 9.84% | 13.34% | 12.84% | 10.92% | 9.06% | 8.90% | 11.22% | 11.07% | 11.46% | 10.71% | 11.20% | 11.81% | -25.15% | -6.76% | -7.88% | -30.96% | -31.54% | -34.16% |
| Total Other Income/Expenses | 1.89B | 3.23B | 1.93B | 1.66B | 56.12M | 737.55M | 866.78M | 1.47B | 1.21B | 8.79M | 83.24M | -196.32M | -218.56M | -252.09M | -25.89M | 411.47M | 339.70M | 224.93M | 128.42M | 110.11M | 72.71M | -92.52M |
| Income Before Tax | 4.95B | 4.68B | 4.67B | 6.44B | 9.64B | 14.96B | 12.77B | 6.20B | 2.87B | 1.94B | 3.30B | 2.53B | 2.18B | 1.90B | 1.55B | 917.92M | 299.56M | 216.32M | 120.10M | 96.55M | 59.30M | -118.55M |
| Income Before Tax Ratio | 2.76% | 3.16% | 4.59% | 6.99% | 9.89% | 14.03% | 13.77% | 11.55% | 9.54% | 8.94% | 11.51% | 10.27% | 10.41% | 9.45% | 11.02% | 21.40% | 233.06% | 169.86% | 113.77% | 220.36% | 139.50% | -155.54% |
| Income Tax Expense | 14.92M | 32.28M | 312.17M | 866.35M | 1.37B | 2.28B | 2.04B | 1.03B | 586.14M | 494.18M | 623.93M | 479.29M | 467.36M | 350.61M | 231.43M | 51.87M | 1.57M | 1.59M | 4.74M | 7.13M | 252.70K | 55.19K |
| Net Income | 5.31B | 5.26B | 4.85B | 5.53B | 8.19B | 12.55B | 10.63B | 5.11B | 2.26B | 1.43B | 2.66B | 2.04B | 1.54B | 1.37B | 1.18B | 879.05M | 302.53M | 209.32M | 115.36M | 86.62M | 61.29M | -112.47M |
| Net Income Ratio | 2.96% | 3.56% | 4.77% | 6.01% | 8.41% | 11.78% | 11.46% | 9.52% | 7.50% | 6.58% | 9.28% | 8.28% | 7.36% | 6.81% | 8.41% | 20.50% | 235.36% | 164.36% | 109.28% | 197.71% | 144.18% | -147.56% |
| EPS | 0.51 | 0.51 | 0.48 | 0.56 | 0.90 | 27.97 | 23.80 | 11.60 | 5.14 | 3.25 | 6.35 | 5.41 | 4.14 | 3.72 | 3.42 | 3.00 | 1.23 | 1.01 | 0.56 | 0.42 | 0.34 | -0.91 |
| EPS Diluted | 0.51 | 0.50 | 0.48 | 0.56 | 0.89 | 27.37 | 23.20 | 11.40 | 5.13 | 3.25 | 6.08 | 5.27 | 3.84 | 3.43 | 3.33 | 2.86 | 1.21 | 0.99 | 0.56 | 0.42 | 0.34 | -0.91 |
| Weighted Avg Shares Out | 10.06B | 10.03B | 9.82B | 9.55B | 9.08B | 448.82M | 446.61M | 441.03M | 440.08M | 440.07M | 419.58M | 377.06M | 372.52M | 365.54M | 346.33M | 292.27M | 246.52M | 206.69M | 206.00M | 206.36M | 179.64M | 123.23M |
| Weighted Avg Shares Out (Dil) | 10.13B | 10.15B | 9.89B | 9.56B | 9.18B | 458.70M | 457.78M | 445.85M | 440.48M | 440.07M | 440.07M | 404.96M | 426.41M | 368.14M | 358.75M | 311.27M | 250.44M | 210.86M | 206.00M | 206.36M | 179.64M | 123.23M |

Exclusive: Geely's premium electric car brand Zeekr seeks over $1 billion in U.S IPO - sources

Geely-Powered Mobility-Tech Firm Ecarx Nears Finish Line For U.S. Listing

Renault to spin off EV arm Ampere, deepens partnerships with Google and Geely

Volvo Car to sell 33% stake in Aurobay to Geely Holding

Renault, Geely strike deal for internal-combustion joint venture

Geely's Zeekr plans electric vehicle sales in Europe in 2023

Geely's Europe expansion continues, Argo robotaxis on the Lyft app and Tesla AI Day takeaways

Chinese automaker Geely snaps up 7.6% stake in Aston Martin

Exclusive-Geely, oil group could take stakes in Renault engine company - sources

China's Geely Automobile first-half profit slumps 35%
Source: https://incomestatements.info
Category: Stock Reports
