See more : Willis Towers Watson Public Limited Company (WTW) Income Statement Analysis – Financial Results
Complete financial analysis of Gold Resource Corporation (GORO) income statement, including revenue, profit margins, EPS and key performance metrics. Get detailed insights into the financial performance of Gold Resource Corporation, a leading company in the Gold industry within the Basic Materials sector.
- XPON Technologies Group Limited (XPN.AX) Income Statement Analysis – Financial Results
- Guangdong Guanghong Holdings Co.,Ltd. (000529.SZ) Income Statement Analysis – Financial Results
- Pacific Health Care Organization, Inc. (PFHO) Income Statement Analysis – Financial Results
- LGB Forge Limited (LGBFORGE.BO) Income Statement Analysis – Financial Results
- Kunming Dianchi Water Treatment Co., Ltd. (3768.HK) Income Statement Analysis – Financial Results
Gold Resource Corporation (GORO)
About Gold Resource Corporation
Gold Resource Corporation engages in the exploration, development, and production of gold and silver projects in Mexico and the United States. The company also explores for copper, lead, and zinc deposits. Its principal asset is the 100% owned Back Forty project covering approximately 1,304 hectares located in Menominee county, Michigan. The company was founded in 1998 and is headquartered in Denver, Colorado.
| Metric | 2023 | 2022 | 2021 | 2020 | 2019 | 2018 | 2017 | 2016 | 2015 | 2014 | 2013 | 2012 | 2011 | 2010 | 2009 | 2008 | 2007 | 2006 | 2005 | 2004 |
|---|---|---|---|---|---|---|---|---|---|---|---|---|---|---|---|---|---|---|---|---|
| Revenue | 97.73M | 138.72M | 125.20M | 90.69M | 135.37M | 115.31M | 110.16M | 83.23M | 92.70M | 115.41M | 125.78M | 131.79M | 105.16M | 14.75M | 0.00 | 0.00 | 0.00 | 0.00 | 6.17K | 113.00 |
| Cost of Revenue | 103.04M | 108.98M | 88.45M | 78.21M | 106.25M | 81.62M | 68.04M | 60.79M | 62.38M | 64.53M | 67.53M | 44.02M | 17.96M | 4.96M | 20.99M | 0.00 | 0.00 | 0.00 | 0.00 | 0.00 |
| Gross Profit | -5.32M | 29.75M | 36.75M | 12.49M | 29.12M | 33.69M | 42.12M | 22.43M | 30.32M | 50.87M | 58.26M | 87.77M | 87.21M | 9.80M | -20.99M | 0.00 | 0.00 | 0.00 | 6.17K | 113.00 |
| Gross Profit Ratio | -5.44% | 21.44% | 29.35% | 13.77% | 21.51% | 29.22% | 38.23% | 26.95% | 32.71% | 44.08% | 46.32% | 66.60% | 82.92% | 66.42% | 0.00% | 0.00% | 0.00% | 0.00% | 100.00% | 100.00% |
| Research & Development | 0.00 | 0.00 | 0.00 | 0.00 | 0.00 | 0.00 | 0.00 | 0.00 | 0.00 | 0.00 | 0.00 | 0.00 | 20.99M | 18.44M | 0.00 | 0.00 | 0.00 | 0.00 | 0.00 | 0.00 |
| General & Administrative | 6.58M | 10.00M | 8.72M | 10.63M | 9.95M | 9.33M | 8.12M | 9.53M | 10.25M | 12.34M | 16.26M | 13.51M | 15.62M | 9.30M | 5.21M | 0.00 | 0.00 | 0.00 | 0.00 | 0.00 |
| Selling & Marketing | 681.00K | 0.00 | 0.00 | 0.00 | 0.00 | 0.00 | 0.00 | 0.00 | 0.00 | 0.00 | 0.00 | 0.00 | 0.00 | 209.00K | 0.00 | 0.00 | 0.00 | 0.00 | 0.00 | 0.00 |
| SG&A | 7.26M | 10.00M | 8.72M | 10.63M | 9.95M | 9.33M | 8.12M | 9.53M | 10.25M | 12.34M | 16.26M | 13.51M | 15.62M | 9.51M | 5.21M | 18.05M | 2.54M | 2.10M | 373.72K | 596.32K |
| Other Expenses | 0.00 | 4.24M | 4.89M | 2.34M | 4.54M | 18.00K | -1.17M | -182.00K | -2.47M | -80.00K | -1.36M | -2.74M | 4.93M | 4.69M | 7.98M | 8.30M | 5.78M | 646.89K | 746.82K | 257.38K |
| Operating Expenses | 7.26M | 14.25M | 13.61M | 12.97M | 14.49M | 15.50M | 12.47M | 13.85M | 17.40M | 19.28M | 47.93M | 38.07M | 41.53M | 32.64M | 13.19M | 26.35M | 8.32M | 2.74M | 1.12M | 853.71K |
| Cost & Expenses | 116.12M | 123.22M | 102.06M | 91.17M | 120.74M | 97.12M | 80.51M | 74.64M | 79.78M | 83.82M | 115.45M | 82.09M | 59.49M | 37.59M | 34.18M | 26.35M | 8.32M | 2.74M | 1.12M | 853.71K |
| Interest Income | 0.00 | 906.00K | 0.00 | 0.00 | 0.00 | 0.00 | 0.00 | 0.00 | 16.00K | 161.00K | 166.00K | 122.00K | 102.00K | 99.00K | 54.50K | 0.00 | 0.00 | 0.00 | 0.00 | 0.00 |
| Interest Expense | 1.47M | 906.00K | 0.00 | 0.00 | 0.00 | 0.00 | 0.00 | 0.00 | 87.00K | 161.00K | 166.00K | 122.00K | 102.00K | 99.00K | 54.50K | 0.00 | 0.00 | 0.00 | 0.00 | 0.00 |
| Depreciation & Amortization | 26.90M | 28.03M | 16.37M | 17.77M | 19.98M | 15.50M | 15.05M | 12.75M | 9.10M | 4.55M | 2.63M | 1.54M | 856.00K | 324.00K | 166.99K | 123.95K | 47.48K | 18.04K | 7.25K | 0.00 |
| EBITDA | 5.15M | 30.27M | 33.64M | 17.12M | 35.48M | 32.05M | 43.53M | 21.90M | 21.67M | 36.14M | 12.96M | 51.24M | 46.63M | -22.68M | -33.96M | -25.89M | -8.03M | -2.67M | -1.21M | -853.59K |
| EBITDA Ratio | 5.27% | 23.84% | 36.08% | 19.13% | 27.72% | 30.36% | 40.53% | 24.55% | 23.75% | 31.66% | 10.30% | 38.88% | 42.05% | -150.34% | 0.00% | 0.00% | 0.00% | 0.00% | -16,254.73% | -755,392.04% |
| Operating Income | -11.90M | 5.71M | 29.03M | -248.00K | 14.20M | 18.19M | 29.54M | 8.59M | 12.92M | 31.59M | 10.33M | 49.70M | 45.67M | -22.84M | -34.18M | -26.35M | -8.32M | -2.74M | -1.22M | -853.59K |
| Operating Income Ratio | -12.17% | 4.12% | 23.18% | -0.27% | 10.49% | 15.77% | 26.81% | 10.32% | 13.94% | 27.37% | 8.21% | 37.71% | 43.43% | -154.80% | 0.00% | 0.00% | 0.00% | 0.00% | -19,726.45% | -755,392.04% |
| Total Other Income/Expenses | -9.85M | -4.46M | -5.55M | -510.00K | -19.13M | -1.46M | -1.06M | 560.00K | -2.47M | -322.00K | -1.36M | -2.74M | 2.41M | -235.00K | 54.50K | 333.61K | 242.51K | 57.09K | 0.00 | 853.59K |
| Income Before Tax | -21.75M | 2.24M | 17.64M | -758.00K | 14.88M | 16.55M | 28.48M | 9.15M | 10.45M | 31.27M | 8.98M | 46.97M | 48.09M | -23.07M | -34.13M | -26.02M | -8.08M | -2.69M | -1.32M | 0.00 |
| Income Before Tax Ratio | -22.26% | 1.61% | 14.09% | -0.84% | 10.99% | 14.35% | 25.85% | 10.99% | 11.28% | 27.09% | 7.14% | 35.64% | 45.73% | -156.39% | 0.00% | 0.00% | 0.00% | 0.00% | -21,403.61% | 0.00% |
| Income Tax Expense | -5.74M | 8.56M | 9.62M | 5.57M | 9.05M | 7.26M | 24.33M | 4.76M | 7.39M | 15.02M | 8.89M | 13.30M | -12.04M | 235.00K | 0.00 | 0.00 | 0.00 | 0.00 | 103.55K | 853.59K |
| Net Income | -16.02M | -6.32M | 8.03M | -6.33M | 5.83M | 9.29M | 4.15M | 4.39M | 3.06M | 16.25M | 85.00K | 33.67M | 58.37M | -23.07M | -34.13M | -26.02M | -8.08M | -2.69M | -1.22M | -853.59K |
| Net Income Ratio | -16.39% | -4.56% | 6.41% | -6.98% | 4.31% | 8.05% | 3.77% | 5.27% | 3.30% | 14.08% | 0.07% | 25.55% | 55.50% | -156.39% | 0.00% | 0.00% | 0.00% | 0.00% | -19,726.45% | -755,392.04% |
| EPS | -0.18 | -0.07 | 0.11 | -0.09 | 0.09 | 0.16 | 0.07 | 0.08 | 0.06 | 0.28 | 0.00 | 0.64 | 1.10 | -0.46 | -0.78 | -0.76 | -0.28 | -0.13 | -0.08 | -0.08 |
| EPS Diluted | -0.18 | -0.07 | 0.11 | -0.09 | 0.09 | 0.16 | 0.07 | 0.08 | 0.06 | 0.28 | 0.00 | 0.60 | 1.03 | -0.46 | -0.78 | -0.76 | -0.28 | -0.13 | -0.08 | -0.08 |
| Weighted Avg Shares Out | 88.51M | 88.37M | 75.30M | 69.90M | 63.68M | 57.53M | 56.85M | 55.14M | 54.19M | 54.12M | 53.26M | 52.85M | 52.98M | 50.04M | 43.76M | 34.39M | 28.65M | 20.22M | 16.16M | 10.83M |
| Weighted Avg Shares Out (Dil) | 88.51M | 88.37M | 75.61M | 69.90M | 64.03M | 58.37M | 57.59M | 55.73M | 54.26M | 54.62M | 55.30M | 56.32M | 56.41M | 50.04M | 43.76M | 34.39M | 28.65M | 20.22M | 16.16M | 10.83M |

Gold Resource Corporation reports on operations in 2022; says gold and silver production at key mine ended 2022 above guidance
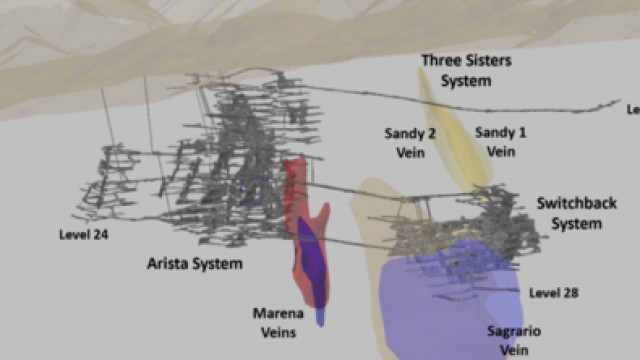
Gold Resource Corporation reports positive drill results at DDGM with potential to improve near-to-mid-term mine plan

Gold Resource Corporation Reports Positive Drill Results at DDGM With the Potential to Improve the Near to Mid-Term Mine Plan

Gold Resource Corporation updates 2023 guidance
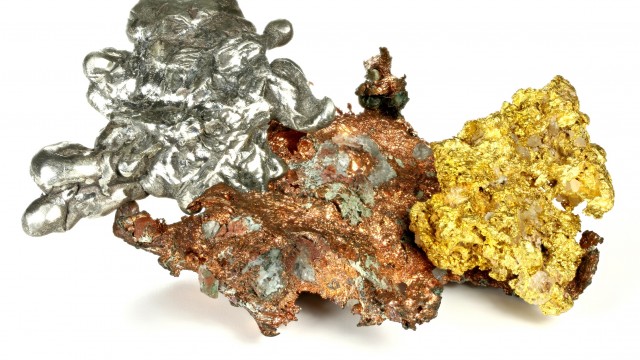
Gold Resource Corporation reports more than 30,000 ounces of gold sold in 2022 after beating production guidance

Gold Resource Corporation Announces Preliminary Results of Over 30,000 Gold Ounces Produced and Sold, Exceeding Production Guidance For 2022

Gold Resource Corporation Declares Quarterly Dividend

Gold Resource Corporation (GORO) Q3 2022 Earnings Call Transcript

Gold Resource says it is on track to meet full year output guidance despite third quarter slowdown to improve safety

Gold Resource Corporation Announces Financial Results for the Third Quarter 2022 and Reiterates 2022 Production and Cost Guidance
Source: https://incomestatements.info
Category: Stock Reports
