See more : Elma Electronic AG (ELMN.SW) Income Statement Analysis – Financial Results
Complete financial analysis of Greatland Gold plc (GRLGF) income statement, including revenue, profit margins, EPS and key performance metrics. Get detailed insights into the financial performance of Greatland Gold plc, a leading company in the Gold industry within the Basic Materials sector.
- Gold By Gold SA (ALGLD.PA) Income Statement Analysis – Financial Results
- Formosan Rubber Group Inc. (2107.TW) Income Statement Analysis – Financial Results
- Khaitan (India) Limited (KHAITANLTD.NS) Income Statement Analysis – Financial Results
- The Boeing Company (BA.SW) Income Statement Analysis – Financial Results
- Pan African Resources PLC (PAFRY) Income Statement Analysis – Financial Results
Greatland Gold plc (GRLGF)
About Greatland Gold plc
Greatland Gold plc engages in the exploration and development of precious and base metals in the United Kingdom and Australia. It explores for gold, copper, cobalt, and nickel deposits. The company's flagship asset is the Havieron deposit in the Paterson region of Western Australia. Greatland Gold plc was incorporated in 2005 and is headquartered in London, the United Kingdom.
| Metric | 2023 | 2022 | 2021 | 2020 | 2019 | 2018 | 2017 | 2016 | 2015 | 2014 | 2013 | 2012 | 2011 | 2010 | 2009 | 2008 | 2007 | 2006 |
|---|---|---|---|---|---|---|---|---|---|---|---|---|---|---|---|---|---|---|
| Revenue | 0.00 | 0.00 | 0.00 | 0.00 | 0.00 | 0.00 | 0.00 | 0.00 | 0.00 | 0.00 | 0.00 | 0.00 | 0.00 | 0.00 | 0.00 | 0.00 | 6.00K | 0.00 |
| Cost of Revenue | 315.00K | 347.69K | 240.83K | 132.63K | 37.13K | 7.58K | 1.41K | 3.32K | 0.00 | 0.00 | 0.00 | 0.00 | 0.00 | 0.00 | 0.00 | 0.00 | 0.00 | 0.00 |
| Gross Profit | -315.00K | -347.69K | -240.83K | -132.63K | -37.13K | -7.58K | -1.41K | -3.32K | 0.00 | 0.00 | 0.00 | 0.00 | 0.00 | 0.00 | 0.00 | 0.00 | 6.00K | 0.00 |
| Gross Profit Ratio | 0.00% | 0.00% | 0.00% | 0.00% | 0.00% | 0.00% | 0.00% | 0.00% | 0.00% | 0.00% | 0.00% | 0.00% | 0.00% | 0.00% | 0.00% | 0.00% | 100.00% | 0.00% |
| Research & Development | 0.00 | 0.00 | 0.00 | 0.00 | 0.00 | 0.00 | 0.00 | 0.00 | 0.00 | 0.00 | 0.00 | 372.96K | 341.00K | 418.00K | 193.00K | 327.00K | 327.00K | 0.00 |
| General & Administrative | 5.72M | 5.42M | 2.20M | 1.63M | 888.66K | 818.94K | 694.19K | 518.89K | 279.43K | 421.14K | 206.79K | 222.38K | 206.00K | 203.00K | 202.00K | 211.00K | 283.00K | 0.00 |
| Selling & Marketing | 12.95M | 0.00 | 0.00 | 0.00 | 0.00 | 0.00 | 0.00 | 0.00 | 0.00 | 0.00 | 0.00 | 0.00 | 0.00 | 0.00 | 0.00 | 0.00 | 0.00 | 0.00 |
| SG&A | 18.67M | 5.42M | 2.20M | 1.63M | 888.66K | 818.94K | 694.19K | 518.89K | 279.43K | 421.14K | 206.79K | 222.38K | 206.00K | 203.00K | 202.00K | 211.00K | 283.00K | 0.00 |
| Other Expenses | 0.00 | 0.00 | 365.65K | 55.44K | 0.00 | 0.00 | 0.00 | 0.00 | 0.00 | 0.00 | 0.00 | 0.00 | 37.27K | 0.00 | 0.00 | -2.00K | -16.00K | 0.00 |
| Operating Expenses | 18.70M | 8.44M | 5.67M | 5.16M | 3.24M | 1.84M | 1.25M | 664.13K | 538.69K | 649.03K | 424.02K | 595.34K | 547.00K | 621.00K | 395.00K | 542.00K | 642.00K | 28.00K |
| Cost & Expenses | 18.70M | 8.44M | 5.67M | 5.16M | 3.24M | 1.84M | 1.25M | 664.13K | 538.69K | 649.03K | 424.02K | 595.34K | 547.00K | 621.00K | 395.00K | 542.00K | 642.00K | 28.00K |
| Interest Income | 1.22M | 1.68K | 982.00 | 17.66K | 5.20K | 3.89K | 1.50K | 1.22K | 1.49K | 1.71K | 1.78K | 4.51K | 4.00K | 4.00K | 39.00K | 85.00K | 27.00K | 0.00 |
| Interest Expense | 56.00K | 192.09K | 17.42K | 21.73K | 15.50K | 0.00 | 0.00 | 0.00 | 0.00 | 0.00 | 0.00 | 0.00 | 0.00 | 0.00 | 0.00 | 0.00 | 0.00 | 0.00 |
| Depreciation & Amortization | 315.00K | 347.69K | 240.83K | 132.63K | 37.13K | 7.58K | 1.41K | 3.32K | 3.53K | 4.92K | 7.85K | 3.94K | 2.00K | 2.00K | 2.00K | 3.00K | 3.00K | 0.00 |
| EBITDA | -18.92M | -11.00M | -5.26M | -4.95M | -3.19M | -1.83M | -1.25M | -660.80K | 5.41K | -427.15K | -416.17K | -591.40K | -504.00K | -615.00K | -354.00K | -448.00K | -570.00K | -28.00K |
| EBITDA Ratio | 0.00% | 0.00% | 0.00% | 0.00% | 0.00% | 0.00% | 0.00% | 0.00% | 0.00% | 0.00% | 0.00% | 0.00% | 0.00% | 0.00% | 0.00% | 0.00% | -9,300.00% | 0.00% |
| Operating Income | -18.98M | -8.44M | -5.67M | -5.20M | -3.25M | -1.84M | -1.25M | -664.13K | -1.08M | -739.25K | -424.02K | -595.34K | -547.00K | -621.00K | -395.00K | -536.00K | -588.00K | -28.00K |
| Operating Income Ratio | 0.00% | 0.00% | 0.00% | 0.00% | 0.00% | 0.00% | 0.00% | 0.00% | 0.00% | 0.00% | 0.00% | 0.00% | 0.00% | 0.00% | 0.00% | 0.00% | -9,800.00% | 0.00% |
| Total Other Income/Expenses | -2.14M | -2.93M | -200.41K | 51.37K | -10.31K | 3.89K | 1.50K | 1.22K | 1.49K | -125.02K | 1.78K | 4.51K | 41.00K | 4.00K | 39.00K | 85.00K | 28.00K | 0.00 |
| Income Before Tax | -21.12M | -11.37M | -5.52M | -5.14M | -3.26M | -1.84M | -1.25M | -662.90K | -1.08M | -864.27K | -422.24K | -590.83K | -506.00K | -617.00K | -356.00K | -451.00K | -561.00K | -28.00K |
| Income Before Tax Ratio | 0.00% | 0.00% | 0.00% | 0.00% | 0.00% | 0.00% | 0.00% | 0.00% | 0.00% | 0.00% | 0.00% | 0.00% | 0.00% | 0.00% | 0.00% | 0.00% | -9,350.00% | 0.00% |
| Income Tax Expense | 0.00 | -2.74M | 172.65K | 111.48K | 23.65K | 0.00 | 0.00 | 0.00 | 1.08M | 307.18K | 0.00 | 0.00 | 41.00K | 4.00K | 39.00K | 85.00K | 27.00K | 0.00 |
| Net Income | -21.12M | -11.37M | -5.52M | -5.14M | -3.26M | -1.84M | -1.25M | -662.90K | -1.08M | -864.27K | -422.24K | -590.83K | -506.00K | -617.00K | -356.00K | -451.00K | -561.00K | -28.00K |
| Net Income Ratio | 0.00% | 0.00% | 0.00% | 0.00% | 0.00% | 0.00% | 0.00% | 0.00% | 0.00% | 0.00% | 0.00% | 0.00% | 0.00% | 0.00% | 0.00% | 0.00% | -9,350.00% | 0.00% |
| EPS | 0.00 | 0.00 | 0.00 | 0.00 | 0.00 | 0.00 | 0.00 | 0.00 | 0.00 | 0.00 | 0.00 | 0.00 | 0.00 | 0.00 | 0.00 | 0.00 | -0.01 | 0.00 |
| EPS Diluted | 0.00 | 0.00 | 0.00 | 0.00 | 0.00 | 0.00 | 0.00 | 0.00 | 0.00 | 0.00 | 0.00 | 0.00 | 0.00 | 0.00 | 0.00 | 0.00 | -0.01 | 0.00 |
| Weighted Avg Shares Out | 4.85B | 4.02B | 3.87B | 3.59B | 3.25B | 2.77B | 1.69B | 1.05B | 741.94M | 543.81M | 350.66M | 303.94M | 290.04M | 245.03M | 201.26M | 193.26M | 110.46M | 12.00M |
| Weighted Avg Shares Out (Dil) | 4.85B | 4.02B | 3.87B | 3.59B | 3.25B | 2.77B | 1.69B | 1.05B | 741.94M | 543.81M | 350.66M | 303.94M | 290.04M | 251.03M | 201.26M | 193.26M | 110.46M | 12.00M |
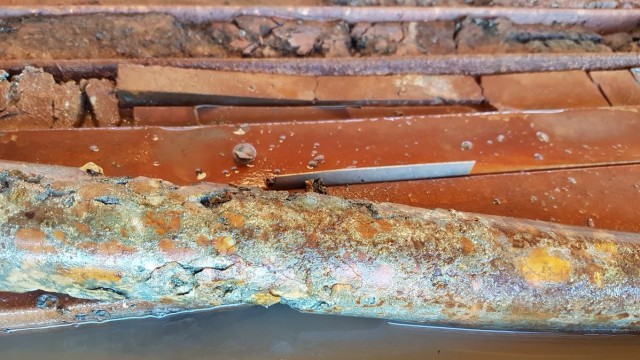
Greatland Gold identifies possible new high grade zone at Havieron

Greatland Gold identifies possible new high grade zone at Havierion
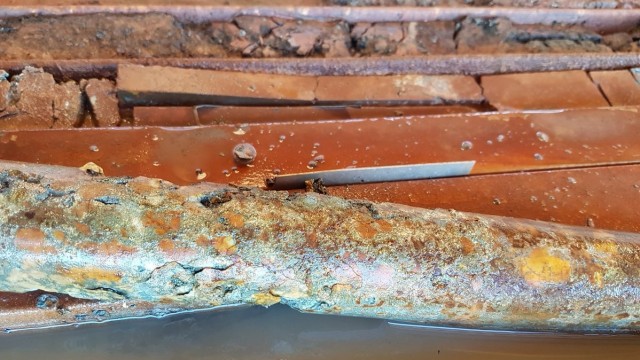
Greatland Gold happy with initial drill results at Juri

Greatland Gold happy with initial exploration at Juri

Greatland Gold says Newcrest wants to exercise option over Havieron
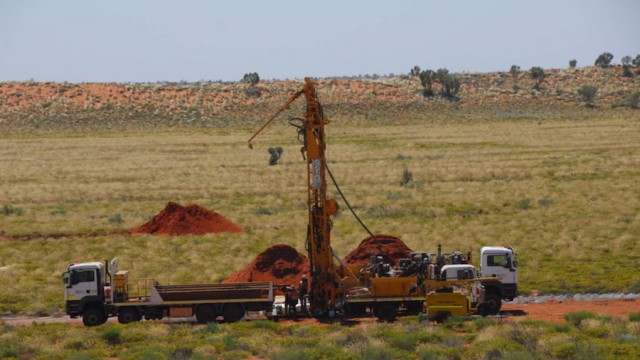
Greatland Gold plans to release new sustainability report meanwhile Havieron continues to impress

Greatland Gold reports further high-grade drilling results from Havieron gold-copper project
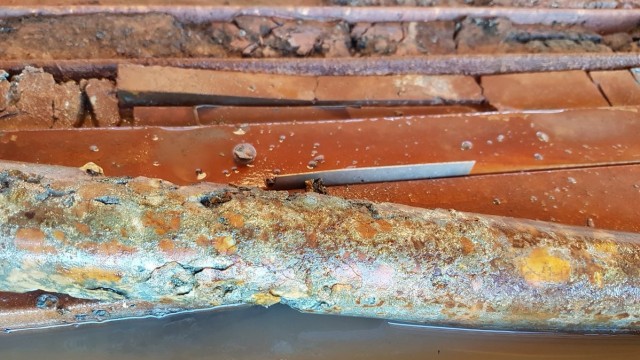
Havieron feasibility study the key for Greatland Gold in 2022, says broker
Greatland Gold raises US$16mln to fast track Havieron gold mine
Source: https://incomestatements.info
Category: Stock Reports

