See more : Spindletop Health Acquisition Corp. (SHCAW) Income Statement Analysis – Financial Results
Complete financial analysis of Greatland Gold plc (GRLGF) income statement, including revenue, profit margins, EPS and key performance metrics. Get detailed insights into the financial performance of Greatland Gold plc, a leading company in the Gold industry within the Basic Materials sector.
- ViviCells International, Inc. (VCII) Income Statement Analysis – Financial Results
- Münchener Rückversicherungs-Gesellschaft Aktiengesellschaft in München (0KFE.L) Income Statement Analysis – Financial Results
- Perception Capital Corp. II (PCCTW) Income Statement Analysis – Financial Results
- Sterling Powergensys Limited (STERPOW.BO) Income Statement Analysis – Financial Results
- PJSC LUKOIL (LKOH.ME) Income Statement Analysis – Financial Results
Greatland Gold plc (GRLGF)
About Greatland Gold plc
Greatland Gold plc engages in the exploration and development of precious and base metals in the United Kingdom and Australia. It explores for gold, copper, cobalt, and nickel deposits. The company's flagship asset is the Havieron deposit in the Paterson region of Western Australia. Greatland Gold plc was incorporated in 2005 and is headquartered in London, the United Kingdom.
| Metric | 2023 | 2022 | 2021 | 2020 | 2019 | 2018 | 2017 | 2016 | 2015 | 2014 | 2013 | 2012 | 2011 | 2010 | 2009 | 2008 | 2007 | 2006 |
|---|---|---|---|---|---|---|---|---|---|---|---|---|---|---|---|---|---|---|
| Revenue | 0.00 | 0.00 | 0.00 | 0.00 | 0.00 | 0.00 | 0.00 | 0.00 | 0.00 | 0.00 | 0.00 | 0.00 | 0.00 | 0.00 | 0.00 | 0.00 | 6.00K | 0.00 |
| Cost of Revenue | 315.00K | 347.69K | 240.83K | 132.63K | 37.13K | 7.58K | 1.41K | 3.32K | 0.00 | 0.00 | 0.00 | 0.00 | 0.00 | 0.00 | 0.00 | 0.00 | 0.00 | 0.00 |
| Gross Profit | -315.00K | -347.69K | -240.83K | -132.63K | -37.13K | -7.58K | -1.41K | -3.32K | 0.00 | 0.00 | 0.00 | 0.00 | 0.00 | 0.00 | 0.00 | 0.00 | 6.00K | 0.00 |
| Gross Profit Ratio | 0.00% | 0.00% | 0.00% | 0.00% | 0.00% | 0.00% | 0.00% | 0.00% | 0.00% | 0.00% | 0.00% | 0.00% | 0.00% | 0.00% | 0.00% | 0.00% | 100.00% | 0.00% |
| Research & Development | 0.00 | 0.00 | 0.00 | 0.00 | 0.00 | 0.00 | 0.00 | 0.00 | 0.00 | 0.00 | 0.00 | 372.96K | 341.00K | 418.00K | 193.00K | 327.00K | 327.00K | 0.00 |
| General & Administrative | 5.72M | 5.42M | 2.20M | 1.63M | 888.66K | 818.94K | 694.19K | 518.89K | 279.43K | 421.14K | 206.79K | 222.38K | 206.00K | 203.00K | 202.00K | 211.00K | 283.00K | 0.00 |
| Selling & Marketing | 12.95M | 0.00 | 0.00 | 0.00 | 0.00 | 0.00 | 0.00 | 0.00 | 0.00 | 0.00 | 0.00 | 0.00 | 0.00 | 0.00 | 0.00 | 0.00 | 0.00 | 0.00 |
| SG&A | 18.67M | 5.42M | 2.20M | 1.63M | 888.66K | 818.94K | 694.19K | 518.89K | 279.43K | 421.14K | 206.79K | 222.38K | 206.00K | 203.00K | 202.00K | 211.00K | 283.00K | 0.00 |
| Other Expenses | 0.00 | 0.00 | 365.65K | 55.44K | 0.00 | 0.00 | 0.00 | 0.00 | 0.00 | 0.00 | 0.00 | 0.00 | 37.27K | 0.00 | 0.00 | -2.00K | -16.00K | 0.00 |
| Operating Expenses | 18.70M | 8.44M | 5.67M | 5.16M | 3.24M | 1.84M | 1.25M | 664.13K | 538.69K | 649.03K | 424.02K | 595.34K | 547.00K | 621.00K | 395.00K | 542.00K | 642.00K | 28.00K |
| Cost & Expenses | 18.70M | 8.44M | 5.67M | 5.16M | 3.24M | 1.84M | 1.25M | 664.13K | 538.69K | 649.03K | 424.02K | 595.34K | 547.00K | 621.00K | 395.00K | 542.00K | 642.00K | 28.00K |
| Interest Income | 1.22M | 1.68K | 982.00 | 17.66K | 5.20K | 3.89K | 1.50K | 1.22K | 1.49K | 1.71K | 1.78K | 4.51K | 4.00K | 4.00K | 39.00K | 85.00K | 27.00K | 0.00 |
| Interest Expense | 56.00K | 192.09K | 17.42K | 21.73K | 15.50K | 0.00 | 0.00 | 0.00 | 0.00 | 0.00 | 0.00 | 0.00 | 0.00 | 0.00 | 0.00 | 0.00 | 0.00 | 0.00 |
| Depreciation & Amortization | 315.00K | 347.69K | 240.83K | 132.63K | 37.13K | 7.58K | 1.41K | 3.32K | 3.53K | 4.92K | 7.85K | 3.94K | 2.00K | 2.00K | 2.00K | 3.00K | 3.00K | 0.00 |
| EBITDA | -18.92M | -11.00M | -5.26M | -4.95M | -3.19M | -1.83M | -1.25M | -660.80K | 5.41K | -427.15K | -416.17K | -591.40K | -504.00K | -615.00K | -354.00K | -448.00K | -570.00K | -28.00K |
| EBITDA Ratio | 0.00% | 0.00% | 0.00% | 0.00% | 0.00% | 0.00% | 0.00% | 0.00% | 0.00% | 0.00% | 0.00% | 0.00% | 0.00% | 0.00% | 0.00% | 0.00% | -9,300.00% | 0.00% |
| Operating Income | -18.98M | -8.44M | -5.67M | -5.20M | -3.25M | -1.84M | -1.25M | -664.13K | -1.08M | -739.25K | -424.02K | -595.34K | -547.00K | -621.00K | -395.00K | -536.00K | -588.00K | -28.00K |
| Operating Income Ratio | 0.00% | 0.00% | 0.00% | 0.00% | 0.00% | 0.00% | 0.00% | 0.00% | 0.00% | 0.00% | 0.00% | 0.00% | 0.00% | 0.00% | 0.00% | 0.00% | -9,800.00% | 0.00% |
| Total Other Income/Expenses | -2.14M | -2.93M | -200.41K | 51.37K | -10.31K | 3.89K | 1.50K | 1.22K | 1.49K | -125.02K | 1.78K | 4.51K | 41.00K | 4.00K | 39.00K | 85.00K | 28.00K | 0.00 |
| Income Before Tax | -21.12M | -11.37M | -5.52M | -5.14M | -3.26M | -1.84M | -1.25M | -662.90K | -1.08M | -864.27K | -422.24K | -590.83K | -506.00K | -617.00K | -356.00K | -451.00K | -561.00K | -28.00K |
| Income Before Tax Ratio | 0.00% | 0.00% | 0.00% | 0.00% | 0.00% | 0.00% | 0.00% | 0.00% | 0.00% | 0.00% | 0.00% | 0.00% | 0.00% | 0.00% | 0.00% | 0.00% | -9,350.00% | 0.00% |
| Income Tax Expense | 0.00 | -2.74M | 172.65K | 111.48K | 23.65K | 0.00 | 0.00 | 0.00 | 1.08M | 307.18K | 0.00 | 0.00 | 41.00K | 4.00K | 39.00K | 85.00K | 27.00K | 0.00 |
| Net Income | -21.12M | -11.37M | -5.52M | -5.14M | -3.26M | -1.84M | -1.25M | -662.90K | -1.08M | -864.27K | -422.24K | -590.83K | -506.00K | -617.00K | -356.00K | -451.00K | -561.00K | -28.00K |
| Net Income Ratio | 0.00% | 0.00% | 0.00% | 0.00% | 0.00% | 0.00% | 0.00% | 0.00% | 0.00% | 0.00% | 0.00% | 0.00% | 0.00% | 0.00% | 0.00% | 0.00% | -9,350.00% | 0.00% |
| EPS | 0.00 | 0.00 | 0.00 | 0.00 | 0.00 | 0.00 | 0.00 | 0.00 | 0.00 | 0.00 | 0.00 | 0.00 | 0.00 | 0.00 | 0.00 | 0.00 | -0.01 | 0.00 |
| EPS Diluted | 0.00 | 0.00 | 0.00 | 0.00 | 0.00 | 0.00 | 0.00 | 0.00 | 0.00 | 0.00 | 0.00 | 0.00 | 0.00 | 0.00 | 0.00 | 0.00 | -0.01 | 0.00 |
| Weighted Avg Shares Out | 4.85B | 4.02B | 3.87B | 3.59B | 3.25B | 2.77B | 1.69B | 1.05B | 741.94M | 543.81M | 350.66M | 303.94M | 290.04M | 245.03M | 201.26M | 193.26M | 110.46M | 12.00M |
| Weighted Avg Shares Out (Dil) | 4.85B | 4.02B | 3.87B | 3.59B | 3.25B | 2.77B | 1.69B | 1.05B | 741.94M | 543.81M | 350.66M | 303.94M | 290.04M | 251.03M | 201.26M | 193.26M | 110.46M | 12.00M |

Endeavour, Fresnillo and Greatland Gold shine as gold and silver prices climb
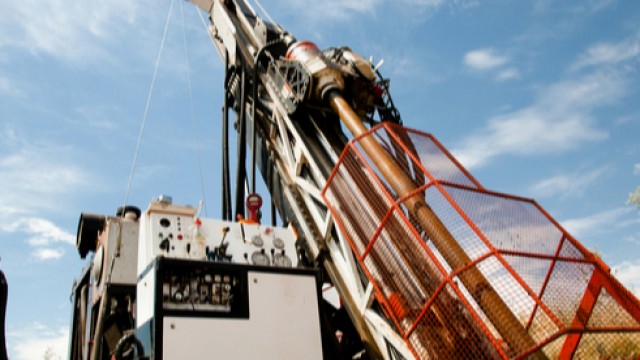
Greatland Gold starts drilling at Ernest Giles following land access agreement

Greatland Gold keen to build portfolio outside of Havieron
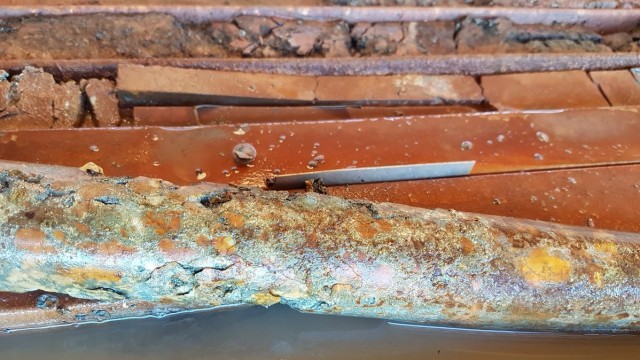
Gretalnd Gold identifies identifies anomalies from maiden Paterson South program
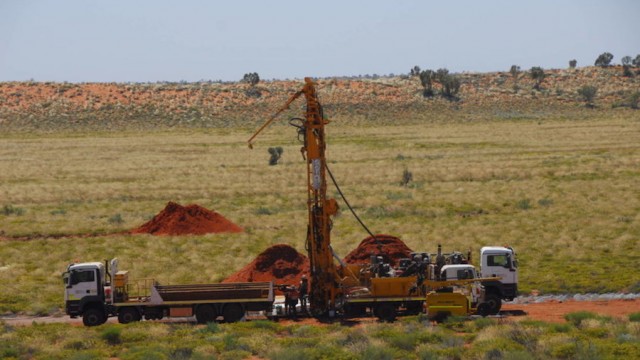
Greatland Gold to incorporate water update in Havieron study
Greatland Gold looking forward to working with Newmont at Havieron
Greatland Gold makes Ernest Giles a high priority after completing land access agreement

Greatland Gold snaps up more acreage in Pilbara
Greatland Gold defers Aussie listing until Havieron final decision
Source: https://incomestatements.info
Category: Stock Reports

