See more : Boa Vista Serviços S.A. (BOAS3.SA) Income Statement Analysis – Financial Results
Complete financial analysis of Holcim Ltd (HCMLY) income statement, including revenue, profit margins, EPS and key performance metrics. Get detailed insights into the financial performance of Holcim Ltd, a leading company in the Construction Materials industry within the Basic Materials sector.
- Solid Clouds hf (SOLID.IC) Income Statement Analysis – Financial Results
- Ocean One Holding Ltd. (8476.HK) Income Statement Analysis – Financial Results
- Sunway Construction Group Bhd (5263.KL) Income Statement Analysis – Financial Results
- Nyxoah S.A. (NYXH) Income Statement Analysis – Financial Results
- Athena Gold Corporation (AHNR) Income Statement Analysis – Financial Results
Holcim Ltd (HCMLY)
About Holcim Ltd
Holcim Ltd, together with its subsidiaries, operates as a building materials and solutions company in the Asia Pacific, Europe, Latin America, the Middle East, Africa, and North America. It operates through four segments: Cement, Aggregates, Ready-mix Concrete, and Solutions & Products. The company offers cement, hydraulic binders, clinker, and other cementitious materials; aggregates, such as crushed stone, gravel, and sand; and ready-mix concrete, precast concrete products, asphalts, and mortars. In addition, it engages in the provision of contracting and other services; and retail activities, as well as waste management services. Its products are used in infrastructure projects, such as roads, mines, ports, dams, data centers, stadiums, wind farms, and electric power plants; building projects comprising individual housing, collective housing, office buildings, industrial and commercial buildings, and public buildings; and affordable housing. The company was formerly known as LafargeHolcim Ltd and changed its name to Holcim Ltd in May 2021. Holcim Ltd was founded in 1833 and is headquartered in Zug, Switzerland.
| Metric | 2023 | 2022 | 2021 | 2020 | 2019 | 2018 | 2017 | 2016 | 2015 | 2014 | 2013 | 2012 | 2011 | 2010 | 2009 | 2008 | 2007 | 2006 | 2005 | 2004 | 2003 | 2002 |
|---|---|---|---|---|---|---|---|---|---|---|---|---|---|---|---|---|---|---|---|---|---|---|
| Revenue | 27.01B | 29.19B | 26.83B | 23.14B | 26.72B | 27.47B | 26.13B | 26.90B | 23.58B | 19.11B | 19.72B | 21.54B | 20.74B | 21.65B | 21.13B | 25.16B | 27.05B | 23.97B | 18.47B | 13.22B | 12.60B | 13.01B |
| Cost of Revenue | 15.51B | 17.58B | 15.30B | 13.45B | 15.44B | 15.92B | 18.35B | 15.63B | 16.49B | 10.55B | 11.09B | 12.75B | 12.22B | 12.38B | 12.07B | 14.12B | 14.07B | 12.62B | 9.70B | 6.62B | 6.56B | 6.77B |
| Gross Profit | 11.50B | 11.61B | 11.54B | 9.69B | 11.28B | 11.55B | 7.78B | 11.27B | 7.09B | 8.56B | 8.63B | 8.79B | 8.53B | 9.27B | 9.06B | 11.04B | 12.98B | 11.35B | 8.77B | 6.60B | 6.04B | 6.24B |
| Gross Profit Ratio | 42.57% | 39.79% | 42.99% | 41.87% | 42.21% | 42.04% | 29.78% | 41.90% | 30.08% | 44.80% | 43.78% | 40.81% | 41.11% | 42.83% | 42.87% | 43.89% | 47.98% | 47.37% | 47.48% | 49.93% | 47.90% | 47.99% |
| Research & Development | 224.00M | 229.00M | 237.00M | 171.00M | 83.00M | 98.00M | 96.00M | 141.00M | 105.00M | 64.00M | 74.00M | 61.00M | 0.00 | 0.00 | 0.00 | 0.00 | 0.00 | 0.00 | 0.00 | 0.00 | 0.00 | 0.00 |
| General & Administrative | 1.32B | 2.09B | 1.38B | 1.21B | 1.34B | 1.78B | 1.94B | 2.04B | 1.95B | 1.32B | 1.25B | 1.48B | 1.37B | 1.38B | 1.45B | 1.76B | 1.81B | 1.61B | 1.33B | 1.05B | 1.02B | 1.21B |
| Selling & Marketing | 5.91B | 6.61B | 6.23B | 5.56B | 6.66B | 6.96B | 6.61B | 6.39B | 5.88B | 4.92B | 5.02B | 5.50B | 5.23B | 5.28B | 4.83B | 5.92B | 6.15B | 5.36B | 4.05B | 2.98B | 2.79B | 2.84B |
| SG&A | 7.22B | 8.70B | 7.61B | 6.77B | 8.00B | 8.74B | 8.55B | 8.44B | 7.83B | 6.25B | 6.28B | 6.98B | 6.60B | 6.66B | 6.28B | 7.68B | 7.96B | 6.97B | 5.38B | 4.03B | 3.81B | 4.05B |
| Other Expenses | -527.00M | 34.00M | -68.00M | 6.00M | 20.00M | -55.00M | -124.00M | 12.00M | -326.00M | -15.00M | -13.00M | -13.00M | 69.00M | 7.00M | -206.00M | 19.00M | 1.24B | 97.00M | 27.00M | -76.00M | -483.00M | -613.00M |
| Operating Expenses | 6.92B | 8.73B | 7.61B | 6.77B | 8.02B | 8.75B | 8.56B | 8.44B | 7.83B | 6.25B | 6.28B | 6.99B | 6.60B | 6.66B | 6.07B | 7.66B | 6.71B | 6.97B | 5.45B | 4.35B | 4.11B | 4.34B |
| Cost & Expenses | 22.43B | 26.31B | 22.91B | 20.22B | 23.46B | 24.67B | 26.90B | 24.07B | 24.32B | 16.80B | 17.37B | 19.74B | 18.81B | 19.03B | 18.15B | 21.78B | 20.79B | 19.58B | 15.15B | 10.96B | 10.68B | 11.11B |
| Interest Income | 108.00M | 108.00M | 64.00M | 88.00M | 100.00M | 85.00M | 92.00M | 132.00M | 126.00M | 96.00M | 120.00M | 133.00M | 191.00M | 262.00M | 173.00M | 271.00M | 227.00M | 188.00M | 146.00M | 0.00 | 0.00 | 0.00 |
| Interest Expense | 568.00M | 465.00M | 434.00M | 489.00M | 710.00M | 814.00M | 818.00M | 950.00M | 735.00M | 511.00M | 597.00M | 655.00M | 1.21B | 897.00M | 881.00M | 990.00M | 1.01B | 962.00M | 877.00M | 0.00 | 0.00 | 0.00 |
| Depreciation & Amortization | 2.08B | 2.16B | 2.32B | 2.30B | 2.48B | 2.22B | 6.01B | 2.35B | 4.42B | 1.43B | 1.54B | 2.17B | 2.03B | 1.89B | 1.85B | 1.97B | 1.91B | 1.70B | 1.31B | 1.34B | 1.39B | 1.44B |
| EBITDA | 6.82B | 6.10B | 6.42B | 5.72B | 6.33B | 5.43B | 5.65B | 5.50B | 4.47B | 3.97B | 4.26B | 4.34B | 3.83B | 5.03B | 5.31B | 5.85B | 8.66B | 6.46B | 4.63B | 3.59B | 3.31B | 3.34B |
| EBITDA Ratio | 25.24% | 20.88% | 24.63% | 24.86% | 23.70% | 19.81% | 20.79% | 20.43% | 16.63% | 20.76% | 20.56% | 19.46% | 21.05% | 23.22% | 25.13% | 23.26% | 32.01% | 26.95% | 25.05% | 27.15% | 26.28% | 25.68% |
| Operating Income | 4.58B | 3.22B | 4.40B | 3.37B | 3.83B | 3.31B | -478.00M | 2.84B | -739.00M | 2.32B | 2.36B | 1.82B | 1.93B | 2.62B | 2.99B | 3.36B | 5.02B | 4.39B | 3.32B | 2.25B | 1.93B | 1.90B |
| Operating Income Ratio | 16.95% | 11.03% | 16.40% | 14.57% | 14.34% | 12.06% | -1.83% | 10.54% | -3.13% | 12.12% | 11.95% | 8.43% | 9.32% | 12.10% | 14.13% | 13.36% | 18.57% | 18.29% | 17.96% | 17.03% | 15.28% | 14.63% |
| Total Other Income/Expenses | -403.00M | 1.33B | -757.00M | -652.00M | -514.00M | -937.00M | -702.00M | -81.00M | 55.00M | -37.00M | -229.00M | -197.00M | -802.00M | -383.00M | -406.00M | -490.00M | 722.00M | -588.00M | -662.00M | -621.00M | -483.00M | -613.00M |
| Income Before Tax | 4.17B | 4.56B | 3.64B | 2.72B | 3.32B | 2.38B | -1.18B | 2.88B | -684.00M | 2.21B | 2.13B | 1.59B | 1.13B | 2.24B | 2.58B | 2.89B | 5.75B | 3.80B | 2.68B | 1.66B | 1.44B | 1.29B |
| Income Before Tax Ratio | 15.45% | 15.61% | 13.58% | 11.75% | 12.42% | 8.65% | -4.52% | 10.71% | -2.90% | 11.55% | 10.79% | 7.36% | 5.45% | 10.33% | 12.21% | 11.48% | 21.24% | 15.84% | 14.53% | 12.58% | 11.44% | 9.92% |
| Income Tax Expense | 998.00M | 1.03B | 963.00M | 717.00M | 806.00M | 656.00M | 536.00M | 835.00M | 781.00M | 588.00M | 533.00M | 558.00M | 449.00M | 615.00M | 623.00M | 663.00M | 1.20B | 1.08B | 865.00M | 510.00M | 510.00M | 493.00M |
| Net Income | 3.06B | 3.31B | 2.30B | 1.70B | 2.25B | 1.50B | -1.68B | 1.79B | -1.47B | 1.29B | 1.27B | 622.00M | 682.00M | 1.62B | 1.96B | 2.23B | 4.55B | 2.72B | 1.82B | 1.15B | 686.00M | 506.00M |
| Net Income Ratio | 11.33% | 11.33% | 8.56% | 7.33% | 8.41% | 5.47% | -6.41% | 6.66% | -6.23% | 6.73% | 6.45% | 2.89% | 3.29% | 7.49% | 9.27% | 8.85% | 16.80% | 11.34% | 9.84% | 8.72% | 5.44% | 3.89% |
| EPS | 5.32 | 5.48 | 3.73 | 2.74 | 3.71 | 2.52 | -2.78 | 2.96 | -3.11 | 3.63 | 3.72 | 1.83 | 2.03 | 4.82 | 6.25 | 7.46 | 15.98 | 10.22 | 7.27 | 4.99 | 3.21 | 2.37 |
| EPS Diluted | 5.35 | 5.46 | 3.72 | 2.74 | 3.70 | 2.52 | -2.78 | 2.96 | -3.11 | 3.63 | 3.72 | 1.83 | 2.03 | 4.82 | 6.25 | 7.45 | 15.83 | 9.93 | 7.06 | 4.70 | 3.14 | 2.37 |
| Weighted Avg Shares Out | 571.96M | 602.75M | 612.90M | 612.77M | 605.98M | 596.19M | 602.52M | 605.68M | 472.36M | 354.55M | 341.77M | 340.04M | 335.79M | 335.98M | 313.04M | 298.57M | 284.36M | 266.13M | 250.03M | 231.04M | 213.39M | 213.32M |
| Weighted Avg Shares Out (Dil) | 569.24M | 602.23M | 612.01M | 612.91M | 606.54M | 596.40M | 603.24M | 606.04M | 472.58M | 354.67M | 341.92M | 340.15M | 335.96M | 336.22M | 313.21M | 298.66M | 287.19M | 273.81M | 257.56M | 245.25M | 218.72M | 213.32M |

March's 17 Ideal 2023 Barrons/Bloomberg Dividend Dogs
Holcim Ltd Unsponsored ADR (HCMLY) Moves to Buy: Rationale Behind the Upgrade

Holcim Ltd (HCMLF) Q4 2022 Earnings Call Transcript

Barron's And Bloomberg 2023 Ideal Dividend Stocks Of The Year

Holcim: I Like Heidelberg More, But Holcim Is Safer
Holcim Ltd Unsponsored ADR (HCMLY) Moves to Buy: Rationale Behind the Upgrade

Holcim Ltd (HCMLF) CEO Jan Jenisch on Q2 2022 Results - Earnings Call Transcript
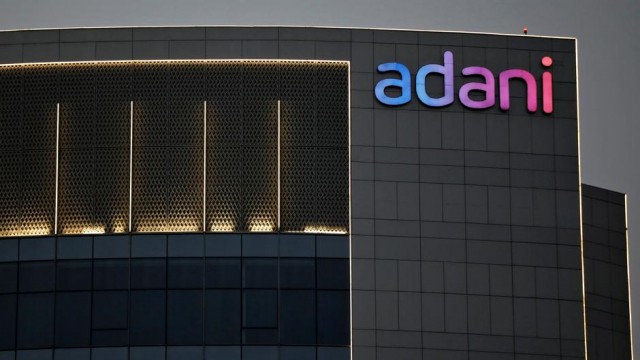
Adani Group to acquire Holcim's India business for $6.39 billion
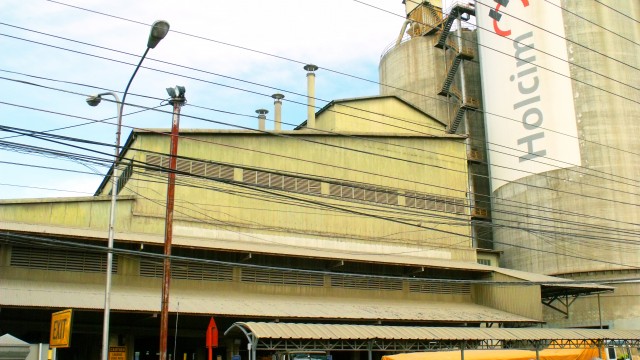
LafargeHolcim: A Follow Up Note On Q1 Performance

Holcim raises full-year sales outlook after Q1 beats forecasts
Source: https://incomestatements.info
Category: Stock Reports
