See more : Danone S.A. (BSN.DE) Income Statement Analysis – Financial Results
Complete financial analysis of HeadHunter Group PLC (HHR) income statement, including revenue, profit margins, EPS and key performance metrics. Get detailed insights into the financial performance of HeadHunter Group PLC, a leading company in the Staffing & Employment Services industry within the Industrials sector.
- Rekah Pharmaceutical Industry Ltd. (REKA.TA) Income Statement Analysis – Financial Results
- Norwegian Energy Company ASA (NOR.OL) Income Statement Analysis – Financial Results
- My Food Bag Group Limited (MFB.NZ) Income Statement Analysis – Financial Results
- PT Visi Telekomunikasi Infrastruktur Tbk (GOLD.JK) Income Statement Analysis – Financial Results
- Hexa Tradex Limited (HEXATRADEX.BO) Income Statement Analysis – Financial Results
HeadHunter Group PLC (HHR)
About HeadHunter Group PLC
HeadHunter Group PLC, together with its subsidiaries, operates an online recruitment platform in Russia, Kazakhstan, Belarus, and internationally. The company offers employers and recruiters paid access to its curriculum vitae database and job postings platform; and job seekers and employers with value-added services. It provides its services for businesses that are looking for job seekers to fill vacancies inside their organizations. The company was formerly known as Zemenik Trading Limited and changed its name to HeadHunter Group PLC in March 2018. The company was founded in 2000 and is headquartered in Moscow, Russia.
| Metric | 2022 | 2021 | 2020 | 2019 | 2018 | 2017 | 2015 |
|---|---|---|---|---|---|---|---|
| Revenue | 18.09B | 15.97B | 8.28B | 7.79B | 6.12B | 4.73B | 3.10B |
| Cost of Revenue | 494.76M | 430.28M | 194.64M | 186.34M | 188.50M | 117.75M | 84.53M |
| Gross Profit | 17.59B | 15.54B | 8.09B | 7.60B | 5.93B | 4.62B | 3.02B |
| Gross Profit Ratio | 97.26% | 97.31% | 97.65% | 97.61% | 96.92% | 97.51% | 97.28% |
| Research & Development | 0.00 | 0.00 | 0.00 | 0.00 | 0.00 | 0.00 | 0.00 |
| General & Administrative | 6.78B | 5.13B | 3.27B | 2.90B | 2.21B | 1.90B | 1.18B |
| Selling & Marketing | 2.41B | 2.11B | 1.11B | 1.05B | 939.72M | 693.25M | 222.24M |
| SG&A | 9.19B | 7.24B | 4.38B | 3.95B | 3.15B | 2.60B | 1.41B |
| Other Expenses | 1.48B | 1.34B | 868.61M | 850.54M | 676.51M | 0.00 | 0.00 |
| Operating Expenses | 10.67B | 8.59B | 5.25B | 4.80B | 3.83B | 3.23B | 1.55B |
| Cost & Expenses | 11.16B | 9.02B | 5.44B | 4.98B | 4.02B | 3.35B | 1.63B |
| Interest Income | 215.96M | 243.11M | 59.33M | 76.76M | 90.27M | 70.92M | 123.40M |
| Interest Expense | 795.36M | 659.58M | 409.55M | 603.28M | 644.33M | 706.04M | 0.00 |
| Depreciation & Amortization | 1.57B | 1.67B | 808.42M | 753.39M | 586.13M | 560.96M | 88.66M |
| EBITDA | 8.49B | 8.62B | 3.65B | 3.56B | 2.78B | 2.02B | 1.68B |
| EBITDA Ratio | 46.96% | 54.01% | 44.05% | 45.69% | 45.37% | 42.59% | 54.27% |
| Operating Income | 6.92B | 6.95B | 2.84B | 2.81B | 2.10B | 1.38B | 1.47B |
| Operating Income Ratio | 38.27% | 43.54% | 34.29% | 36.02% | 34.31% | 29.25% | 47.42% |
| Total Other Income/Expenses | -1.69B | -84.93M | -268.65M | -579.71M | -556.34M | -99.70M | 197.99M |
| Income Before Tax | 5.24B | 6.87B | 2.57B | 2.23B | 1.54B | 1.28B | 1.67B |
| Income Before Tax Ratio | 28.95% | 43.01% | 31.05% | 28.57% | 25.21% | 27.14% | 53.79% |
| Income Tax Expense | 1.54B | 1.37B | 685.77M | 644.42M | 509.60M | 820.83M | 393.82M |
| Net Income | 3.65B | 5.39B | 1.75B | 1.45B | 949.31M | 401.49M | 1.23B |
| Net Income Ratio | 20.19% | 33.76% | 21.12% | 18.59% | 15.52% | 8.48% | 39.51% |
| EPS | 72.65 | 106.75 | 0.00 | 28.96 | 18.99 | 8.00 | 24.52 |
| EPS Diluted | 70.86 | 103.96 | 0.00 | 28.42 | 18.99 | 8.00 | 24.52 |
| Weighted Avg Shares Out | 50.26M | 50.50M | 0.00 | 50.00M | 50.00M | 50.00M | 50.00M |
| Weighted Avg Shares Out (Dil) | 51.54M | 51.86M | 0.00 | 50.96M | 50.00M | 50.00M | 50.00M |

HeadHunter Group PLC to Announce Third Quarter 2020 Financial Results on November 20, 2020

HeadHunter Group PLC Announces Results of 2020 Annual General Meeting

Reviewing HeadHunter Group (HHR) and The Competition

Nuclear Receptor ROR-Gamma Market Trend, Development Analysis 2020 - Top Countries Data Analysis by Industry Share, Future Prospects, Industry Scope, Opportunity, Boosting Strategies, COVID-19 Impact by 2025

HeadHunter Group (HHR) & Its Peers Financial Review

Head to Head Review: HeadHunter Group (HHR) versus Its Rivals

HeadHunter Group PLC (HHR) CEO Mikhail Zhukov on Q2 2020 Results - Earnings Call Transcript

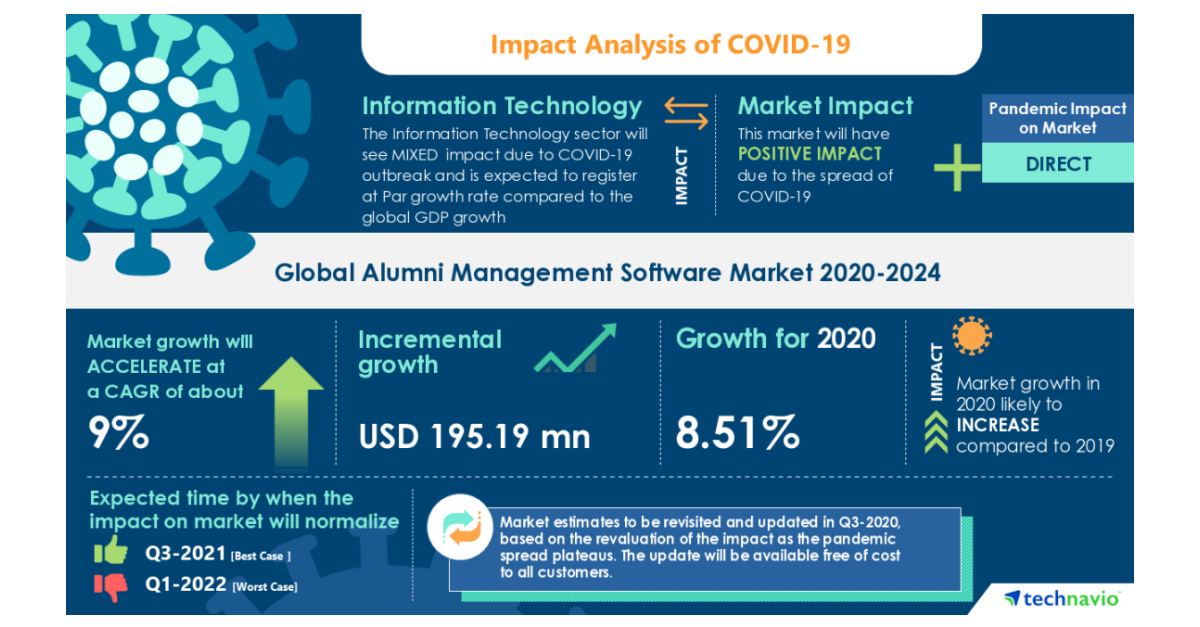
COVID-19 Impacts: Alumni Management Software Market Will Accelerate at a CAGR of About 9% Through 2020-2024 | Demand for Cloud-based Management Tools to Boost Growth | Technavio
Source: https://incomestatements.info
Category: Stock Reports


