See more : SusGlobal Energy Corp. (SNRG) Income Statement Analysis – Financial Results
Complete financial analysis of Hillenbrand, Inc. (HI) income statement, including revenue, profit margins, EPS and key performance metrics. Get detailed insights into the financial performance of Hillenbrand, Inc., a leading company in the Industrial – Machinery industry within the Industrials sector.
- Citizens Financial Corporation (CFIN) Income Statement Analysis – Financial Results
- Saudi Vitrified Clay Pipe Company (2360.SR) Income Statement Analysis – Financial Results
- Gracell Biotechnologies Inc. (GRCL) Income Statement Analysis – Financial Results
- 450 Plc (450.L) Income Statement Analysis – Financial Results
- Leonteq AG (0QNE.L) Income Statement Analysis – Financial Results
Hillenbrand, Inc. (HI)
About Hillenbrand, Inc.
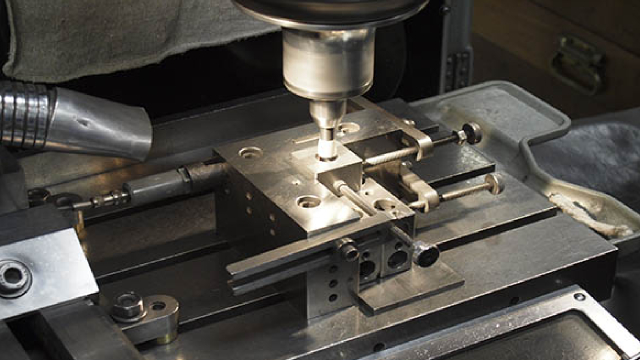
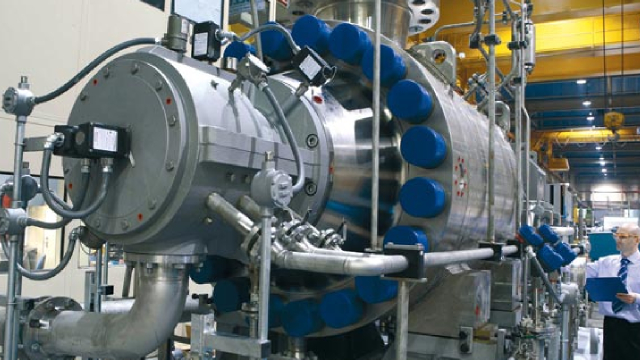
Hillenbrand, Inc. operates as a diversified industrial company in the United States and internationally. It operates in three segments: Advanced Process Solutions, Molding Technology Solutions, and Batesville. The Advanced Process Solutions segment designs, engineers, manufactures, markets, and services process and material handling equipment and systems comprising compounding, extrusion, and material handling equipment, as well as offers equipment system design services; and provides screening and separating equipment for various industries, including plastics, food and pharmaceuticals, chemicals, fertilizers, minerals, energy, wastewater treatment, forest products, and other general industrials. The Molding Technology Solutions segment offers injection molding and extrusion equipment; hot runner systems; process control systems; and mold bases and components for various industries, including automotive, consumer goods, medical, packaging, construction, and electronics. The Batesville segment designs, manufactures, distributes, and sells funeral services products and solutions, such as burial caskets, cremation caskets, containers and urns, other personalization and memorialization products, and web-based technology applications. The company was founded in 1906 and is headquartered in Batesville, Indiana.
| Metric | 2024 | 2023 | 2022 | 2021 | 2020 | 2019 | 2018 | 2017 | 2016 | 2015 | 2014 | 2013 | 2012 | 2011 | 2010 | 2009 | 2008 | 2007 | 2006 | 2005 | 2004 | 2003 | 2002 | 2001 | 2000 |
|---|---|---|---|---|---|---|---|---|---|---|---|---|---|---|---|---|---|---|---|---|---|---|---|---|---|
| Revenue | 3.18B | 2.83B | 2.94B | 2.86B | 2.52B | 1.81B | 1.77B | 1.59B | 1.54B | 1.60B | 1.67B | 1.55B | 983.20M | 883.40M | 749.20M | 649.10M | 678.10M | 667.20M | 1.96B | 659.40M | 640.30M | 1.69B | 1.74B | 1.67B | 1.64B |
| Cost of Revenue | 2.13B | 1.88B | 1.99B | 1.91B | 1.70B | 1.18B | 1.13B | 998.90M | 967.80M | 1.03B | 1.08B | 1.03B | 594.30M | 513.50M | 435.90M | 374.70M | 397.60M | 388.60M | 1.11B | 0.00 | 0.00 | 0.00 | 0.00 | 0.00 | 0.00 |
| Gross Profit | 1.06B | 948.20M | 954.60M | 957.30M | 813.30M | 623.00M | 642.90M | 591.30M | 570.60M | 570.40M | 589.20M | 527.20M | 388.90M | 369.90M | 313.30M | 274.40M | 280.50M | 278.60M | 849.80M | 659.40M | 640.30M | 1.69B | 1.74B | 1.67B | 1.64B |
| Gross Profit Ratio | 33.19% | 33.55% | 32.46% | 33.42% | 32.31% | 34.47% | 36.32% | 37.18% | 37.09% | 35.72% | 35.34% | 33.94% | 39.55% | 41.87% | 41.82% | 42.27% | 41.37% | 41.76% | 43.29% | 100.00% | 100.00% | 100.00% | 100.00% | 100.00% | 100.00% |
| Research & Development | 0.00 | 25.40M | 19.80M | 21.40M | 18.60M | 10.60M | 11.70M | 11.90M | 12.60M | 12.70M | 14.40M | 0.00 | 5.20M | 0.00 | 0.00 | 0.00 | 0.00 | 0.00 | 0.00 | 0.00 | 0.00 | 0.00 | 0.00 | 0.00 | 0.00 |
| General & Administrative | 0.00 | 0.00 | 0.00 | 0.00 | 0.00 | 0.00 | 0.00 | 0.00 | 0.00 | 17.70M | 0.00 | 0.00 | 0.00 | 0.00 | 0.00 | 0.00 | 0.00 | 0.00 | 0.00 | 0.00 | 0.00 | 0.00 | 0.00 | 0.00 | 0.00 |
| Selling & Marketing | 0.00 | 0.00 | 0.00 | 0.00 | 0.00 | 0.00 | 0.00 | 0.00 | 0.00 | 0.00 | 0.00 | 0.00 | 0.00 | 0.00 | 0.00 | 0.00 | 0.00 | 0.00 | 0.00 | 0.00 | 0.00 | 0.00 | 0.00 | 0.00 | 0.00 |
| SG&A | 0.00 | 544.20M | 420.20M | 464.90M | 433.40M | 343.50M | 362.40M | 327.90M | 322.30M | 17.70M | 348.40M | 318.60M | 240.10M | 211.30M | 0.00 | 0.00 | 130.90M | 0.00 | 0.00 | 0.00 | 0.00 | 0.00 | 0.00 | 0.00 | 0.00 |
| Other Expenses | 1.06B | 574.00M | 576.10M | 582.10M | 610.10M | 412.20M | -600.00K | -4.20M | -1.70M | -1.40M | 2.20M | -500.00K | 240.10M | 211.30M | 175.40M | 119.40M | 0.00 | 117.90M | 526.80M | 0.00 | 0.00 | 1.36B | 1.69B | 1.43B | 1.43B |
| Operating Expenses | 1.06B | 948.20M | 576.10M | 582.10M | 610.10M | 412.20M | 409.10M | 373.60M | 379.50M | 376.40M | 414.70M | 409.10M | 240.10M | 211.30M | 175.40M | 119.40M | 130.90M | 117.90M | 526.80M | 0.00 | 0.00 | 1.36B | 1.69B | 1.43B | 1.43B |
| Cost & Expenses | 3.18B | 2.41B | 2.56B | 2.49B | 2.31B | 1.60B | 1.54B | 1.37B | 1.35B | 1.40B | 1.49B | 1.44B | 834.40M | 724.80M | 611.30M | 494.10M | 528.50M | 506.50M | 1.64B | 0.00 | 0.00 | 1.36B | 1.69B | 1.43B | 1.43B |
| Interest Income | 0.00 | 0.00 | 5.50M | 3.40M | 3.20M | 32.70M | 1.40M | 0.00 | 0.00 | 0.00 | 0.00 | 0.00 | 0.00 | 11.80M | 12.20M | 13.50M | 7.50M | 1.40M | 42.70M | 0.00 | 0.00 | 0.00 | 0.00 | 0.00 | 0.00 |
| Interest Expense | 121.50M | 77.70M | 69.80M | 77.60M | 77.40M | 27.40M | 23.30M | 25.20M | 25.30M | 23.80M | 23.30M | 24.00M | 12.40M | 11.00M | 4.20M | 2.10M | 2.20M | 1.40M | 21.30M | 0.00 | 0.00 | 0.00 | 0.00 | 0.00 | 0.00 |
| Depreciation & Amortization | 158.00M | 125.60M | 98.60M | 115.10M | 130.60M | 58.50M | 56.50M | 56.60M | 60.40M | 54.30M | 58.40M | 89.40M | 40.40M | 36.10M | 28.50M | 18.60M | 19.10M | 18.50M | 108.80M | 0.00 | 0.00 | 0.00 | 0.00 | 0.00 | 0.00 |
| EBITDA | 140.10M | 420.20M | 401.50M | 546.50M | 330.40M | 269.20M | 296.10M | 286.90M | 269.90M | 278.90M | 267.70M | 250.60M | 187.70M | 204.90M | 179.10M | 181.50M | 174.60M | 175.50M | 195.10M | 659.40M | 640.30M | 331.30M | 46.00M | 242.00M | 204.00M |
| EBITDA Ratio | 4.40% | 14.87% | 14.99% | 15.05% | 10.95% | 13.09% | 14.88% | 15.26% | 14.46% | 15.33% | 14.27% | 13.24% | 19.41% | 23.38% | 23.84% | 28.82% | 24.88% | 26.86% | 24.17% | 100.00% | 100.00% | 19.56% | 2.65% | 14.47% | 12.46% |
| Operating Income | 0.00 | 411.80M | 386.90M | 375.50M | 203.70M | 204.10M | 233.80M | 217.70M | 191.10M | 194.00M | 174.50M | 118.10M | 148.80M | 158.60M | 137.90M | 155.00M | 149.60M | 160.70M | 323.00M | 659.40M | 640.30M | 331.30M | 46.00M | 242.00M | 204.00M |
| Operating Income Ratio | 0.00% | 14.57% | 13.16% | 13.11% | 8.09% | 11.29% | 13.21% | 13.69% | 12.42% | 12.15% | 10.47% | 7.60% | 15.13% | 17.95% | 18.41% | 23.88% | 22.06% | 24.09% | 16.46% | 100.00% | 100.00% | 19.56% | 2.65% | 14.47% | 12.46% |
| Total Other Income/Expenses | -139.40M | -194.90M | -137.40M | -21.70M | -271.60M | -34.10M | -86.50M | -29.80M | -27.00M | -31.70M | -14.60M | -24.40M | -13.90M | -800.00K | 8.50M | 5.80M | 3.70M | 1.40M | -144.20M | -659.40M | -640.30M | -51.00M | -27.00M | -21.00M | 0.00 |
| Income Before Tax | -139.40M | 216.90M | 314.00M | 353.80M | -18.50M | 176.70M | 146.50M | 188.30M | 164.10M | 162.30M | 159.90M | 93.70M | 134.90M | 157.80M | 146.40M | 160.80M | 153.30M | 157.00M | 339.00M | 0.00 | 0.00 | 280.30M | 19.00M | 221.00M | 204.00M |
| Income Before Tax Ratio | -4.38% | 7.68% | 10.68% | 12.35% | -0.74% | 9.78% | 8.28% | 11.84% | 10.67% | 10.16% | 9.59% | 6.03% | 13.72% | 17.86% | 19.54% | 24.77% | 22.61% | 23.53% | 17.27% | 0.00% | 0.00% | 16.55% | 1.09% | 13.21% | 12.46% |
| Income Tax Expense | 64.80M | 102.80M | 98.80M | 98.60M | 34.90M | 50.50M | 65.30M | 59.90M | 47.30M | 49.10M | 48.70M | 28.30M | 30.10M | 51.70M | 54.10M | 58.50M | 60.10M | 57.50M | 117.50M | -102.80M | -113.80M | 99.70M | -37.00M | 52.00M | 74.00M |
| Net Income | -204.20M | 569.70M | 208.90M | 249.90M | -53.40M | 121.40M | 76.60M | 126.20M | 112.80M | 111.40M | 109.70M | 63.40M | 104.80M | 106.10M | 92.30M | 102.30M | 93.20M | 99.50M | 221.20M | 102.80M | 113.80M | 189.00M | 44.00M | 170.00M | 154.00M |
| Net Income Ratio | -6.42% | 20.16% | 7.10% | 8.72% | -2.12% | 6.72% | 4.33% | 7.94% | 7.33% | 6.98% | 6.58% | 4.08% | 10.66% | 12.01% | 12.32% | 15.76% | 13.74% | 14.91% | 11.27% | 15.59% | 17.77% | 11.16% | 2.53% | 10.16% | 9.41% |
| EPS | -2.90 | 8.16 | 2.91 | 3.34 | -0.73 | 1.93 | 1.21 | 1.99 | 1.78 | 1.76 | 1.74 | 1.01 | 1.68 | 1.71 | 1.49 | 1.66 | 1.49 | 1.59 | 1.82 | 1.64 | 1.82 | 3.02 | 0.70 | 2.72 | 2.46 |
| EPS Diluted | -2.90 | 8.13 | 2.89 | 3.31 | -0.73 | 1.92 | 1.20 | 1.97 | 1.77 | 1.74 | 1.72 | 1.01 | 1.68 | 1.71 | 1.49 | 1.66 | 1.49 | 1.59 | 1.82 | 1.64 | 1.82 | 3.02 | 0.70 | 2.72 | 2.46 |
| Weighted Avg Shares Out | 70.40M | 69.80M | 71.70M | 74.90M | 73.40M | 62.90M | 63.10M | 63.60M | 63.30M | 63.20M | 63.20M | 62.70M | 62.20M | 62.00M | 61.90M | 61.70M | 62.50M | 62.50M | 62.30M | 62.68M | 62.53M | 62.50M | 62.50M | 62.50M | 62.50M |
| Weighted Avg Shares Out (Dil) | 70.40M | 70.10M | 72.20M | 75.40M | 73.40M | 63.30M | 63.80M | 64.00M | 63.80M | 63.90M | 63.80M | 63.00M | 62.40M | 62.00M | 61.90M | 61.70M | 62.50M | 62.50M | 62.30M | 62.68M | 62.53M | 62.68M | 62.68M | 62.68M | 62.68M |

Hillenbrand, Inc. (HI) Q2 2024 Earnings Call Transcript

Hillenbrand (HI) Q3 Earnings Top Estimates

Hillenbrand Reports Fiscal Third Quarter 2024 Results

Earnings Preview: Hillenbrand (HI) Q3 Earnings Expected to Decline

The Top 3 Manufacturing Stocks to Buy Now: Summer 2024

Hillenbrand Schedules Third Quarter 2024 Earnings Call for August 8, 2024

Death Care Services - Global and Regional Market Trends and Analysis 2024-2030 Featuring Profiles of 220 Major Companies, Including Doric Products, Hillenbrand, 1-800-Flowers.com, and Co-operative Group

Hillenbrand Will Be Able To Achieve Its Updated Guidance, Setting Stage For FY25: Analyst

Hillenbrand Transformed (Ratings Upgrade)

Hillenbrand Releases 2023 Sustainability Report
Source: https://incomestatements.info
Category: Stock Reports
